KubernetesClusterZombieProcesses
Overview
Section titled “Overview”Zombie (or defunct) processes can occur on systems when a parent process spawns a child and fails to clean up the process after it finishes executing. When processes are regularly left in this state, it can lead to PID and file handle exhaustion, thread contention, and several other problematic states. It is usually the result of bugs in code that leave processes in this state.
If this alert is firing, we should check the graphs to determine when processes started being left in this state, if the start of leaking processes correlates to a recent deployment, we may consider rolling back the code. We may also want to locate the workload responsible for the leaking processes, and pre-emptively restart these pods to alleviate some of the symptoms associated with the state temporarily.
Services
Section titled “Services”- This alert can apply to any workload running in Kubernetes.
- See the Troubleshooting section for how to locate the workloads spawning the zombie processes.
- Once the workload is identified, refer to the service catalog for the owning team.
- Owner: Fleet Management
Metrics
Section titled “Metrics”- Metric in Grafana Explore
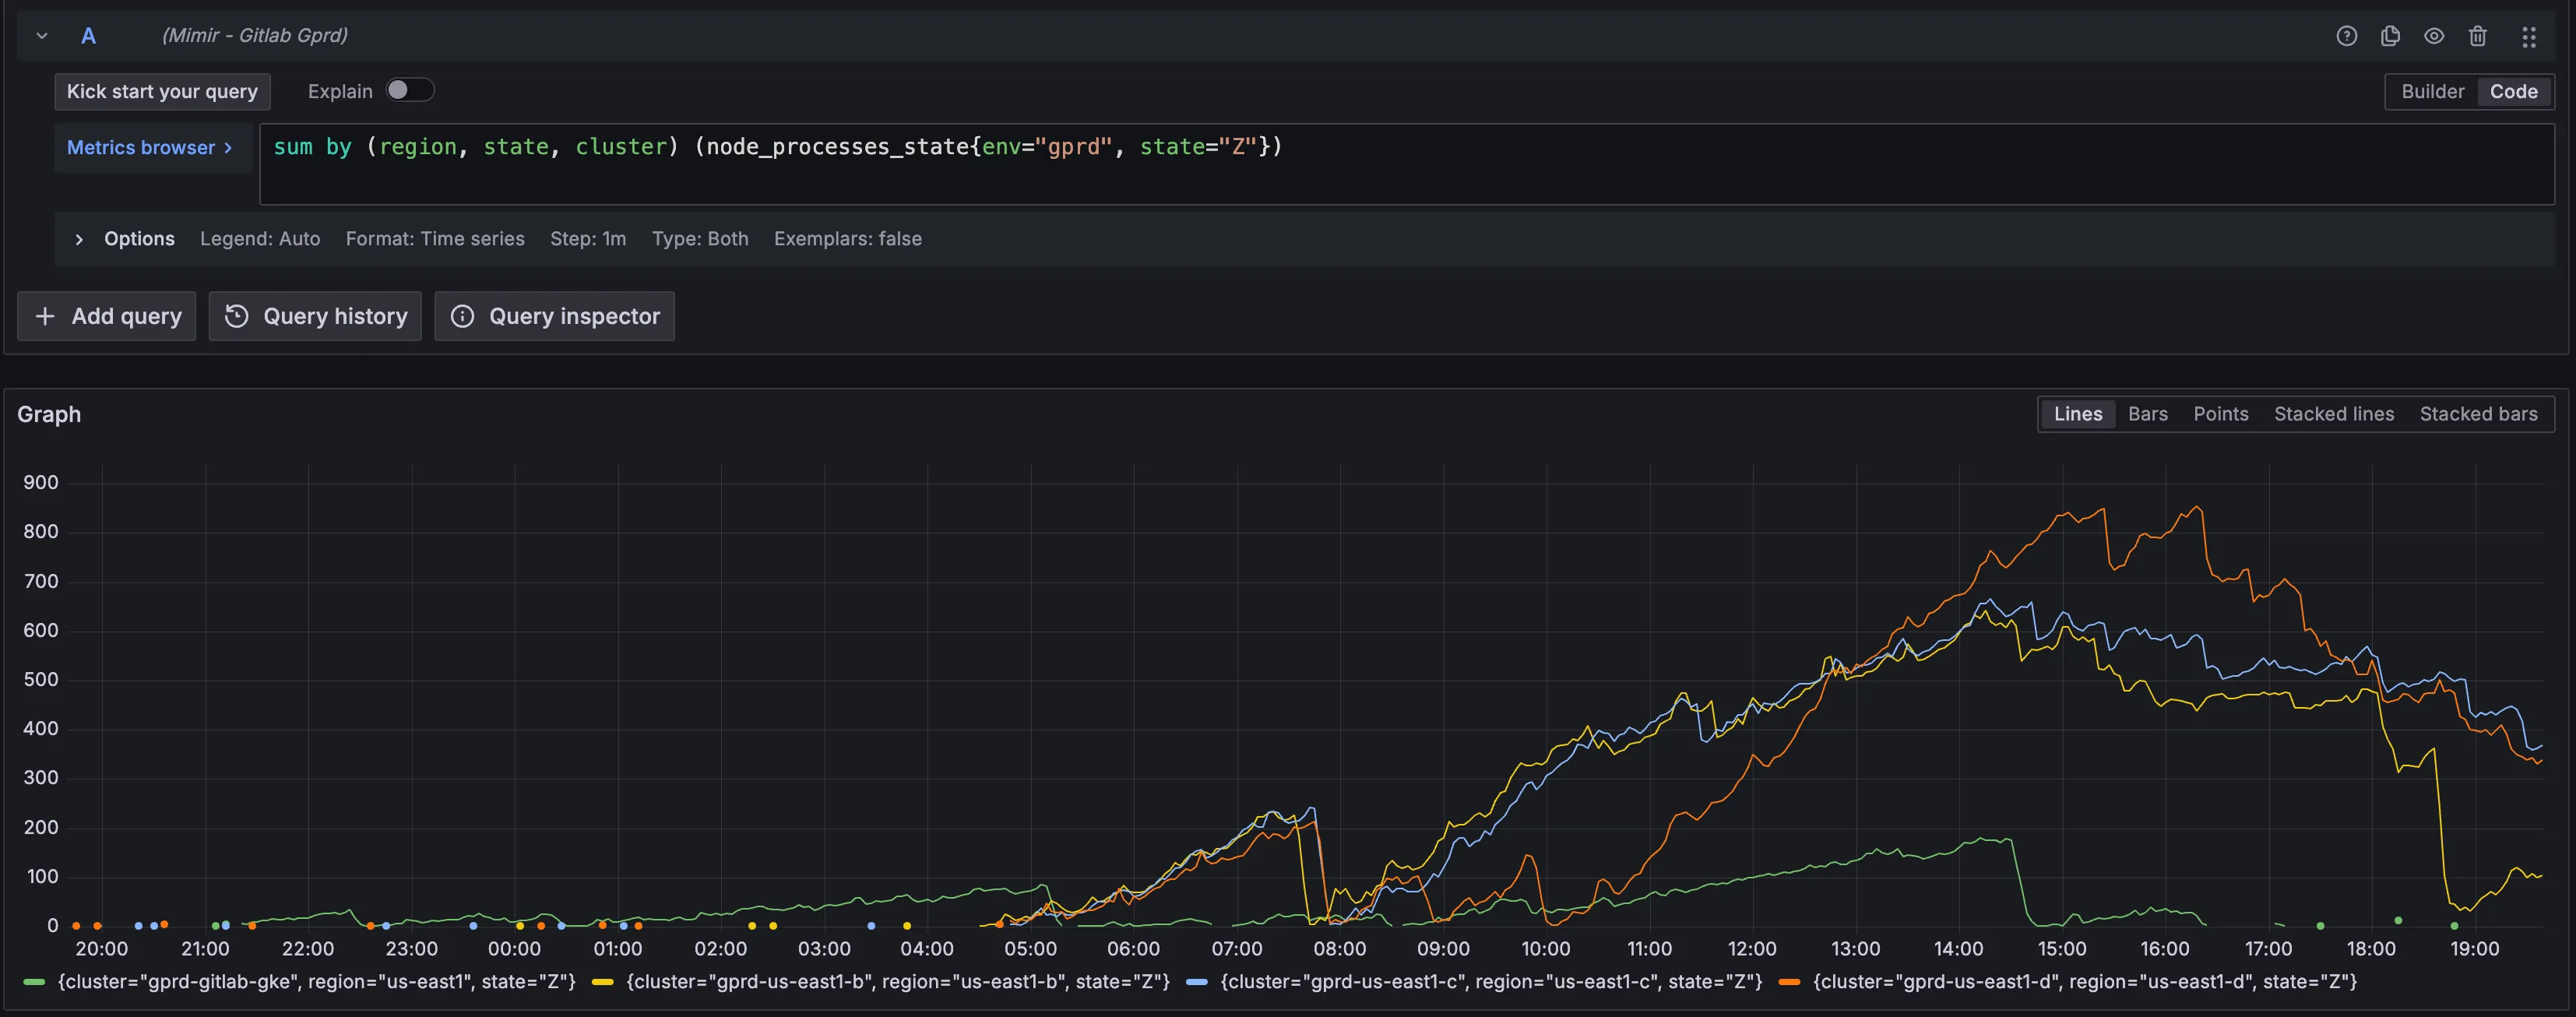
- Some zombie/defunct process churn is normal during day to day operations. The alert requires that the number of zombie processes be greater than 25 on a cluster for 15 minutes or longer before it will fire.
- We should use this metric to detect when these processes are being created but not removed automatically.
- An example of a problematic state:
Alert Behavior
Section titled “Alert Behavior”- This alert is intended to capture problems that exist across entire deployments in a given cluster, as opposed to individual workloads. Alerts are aggregated by cluster for this reason. Any created silence has the potential to mask additional new causes of the alert as long as it exists and should be done so for short durations, and with care.
Severities
Section titled “Severities”- This alert will capture symptomatic states of different issues and doesn’t represent an immediate problem on its own. Assigning a
S3severity may be appropriate if no additional alerts are firing. - There is a high likelihood that the cause of zombie/defunct processes being spawned will also result in Apdex violations that result in
S2incidents, so this should not be ignored.
Verification
Section titled “Verification”- Refer to the metric in Grafana Explore and verify that the zombie process counts are rising, and not simply the result of a spike that has subsided.
Recent changes
Section titled “Recent changes”- Look for recent deployments to the GPRD environment to determine if recent code changes have been deployed. A rollback may need to be considered if so.
Troubleshooting
Section titled “Troubleshooting”-
Break down the metric by node to find hosts with zombies:
sum(node_processes_state{state="Z"}) by (instance, cluster) -
SSH to a node with zombies (see k8s-oncall-setup.md) and list defunct processes:
Terminal window ps -ef | awk '$2 ~ /^[0-9]+$/ && $8 ~ /<defunct>/'Note the parent PID (PPID) of the defunct process — that is the process leaking children.
-
Map the parent PID to a container:
Terminal window PPID=<parent-pid>bash ~/runbooks/scripts/gke/container_id_for_pid.sh "$PPID"crictl inspect <container-id> | jq '.status.metadata.name, .info.runtimeSpec.annotations["io.kubernetes.pod.namespace"], .info.runtimeSpec.annotations["io.kubernetes.pod.name"]'This gives you the container name, namespace, and pod. Match those back to the workload.
-
Escalate to the workload owner. Restarting the affected pods clears zombies temporarily but the leak returns until the code is fixed.
Possible Resolutions
Section titled “Possible Resolutions”Escalation
Section titled “Escalation”- Escalate to the team responsible for the service likely to be spawning the zombie processes.
- If unsure about the service resulting in the leaked PIDs, escalate to
#g_production_engineering