BlackboxProbeFailures
Overview
Section titled “Overview”-
The alert BlackboxProbeFailures is designed to notify you when the success rate of probes executed by the Blackbox exporter falls below 75% for 10 minutes. The instances in
gprdare taken into consideration by the alert excluding the followinghttps://ops.gitlab.net/users/sign_inhttps://dev.gitlab.org.*https://pre.gitlab.comhttps://registry.pre.gitlab.comhttps://status.gitlab.comhttps://new-sentry.gitlab.nethttps://staging.gitlab.com.*
-
A variety of factors can cause a probe to fail: a GCP outage, Cloudflare event, expired SSL certificate, or a breaking change.
-
The service affected depends on the endpoint the probes failed for, the team owning the service can be determined in the Service Catalog by searching for the service name.
-
The recipient is supposed to check if the endpoint is reachable; if not, check for logs and try to figure out the cause of a endpoint being unreachable, and then fix it or escalate it.
Services
Section titled “Services”- Blackbox Exporter Service
- Team that owns the service: Scalibility:Observability
Metrics
Section titled “Metrics”-
The metric in the provided Prometheus query is based on the success rate of probes executed by a Prometheus blackbox exporter. Link to the metrics catalog
avg_over_time(probe_success{...}[10m]) * 100 < 75: This part of the query calculates the average success rate over the past 10 minutes. The probe_success metric indicates whether the probe was successful (1 for success, 0 for failure). Multiplying by 100 converts this rate to a percentage. The condition < 75 triggers the alert if the average success rate falls below 75%. -
Given the reliance on DNS and network connectivity, the blackbox thresholds are chosen to minimize false alerts for minor and transient problems outside our control. It’s still possible that a false alarm could result, but even if there is a non-service related cause for more than 10 minutes, we would want the engineer on call to be aware of it.
-
Example of the metric while the alert is firing:
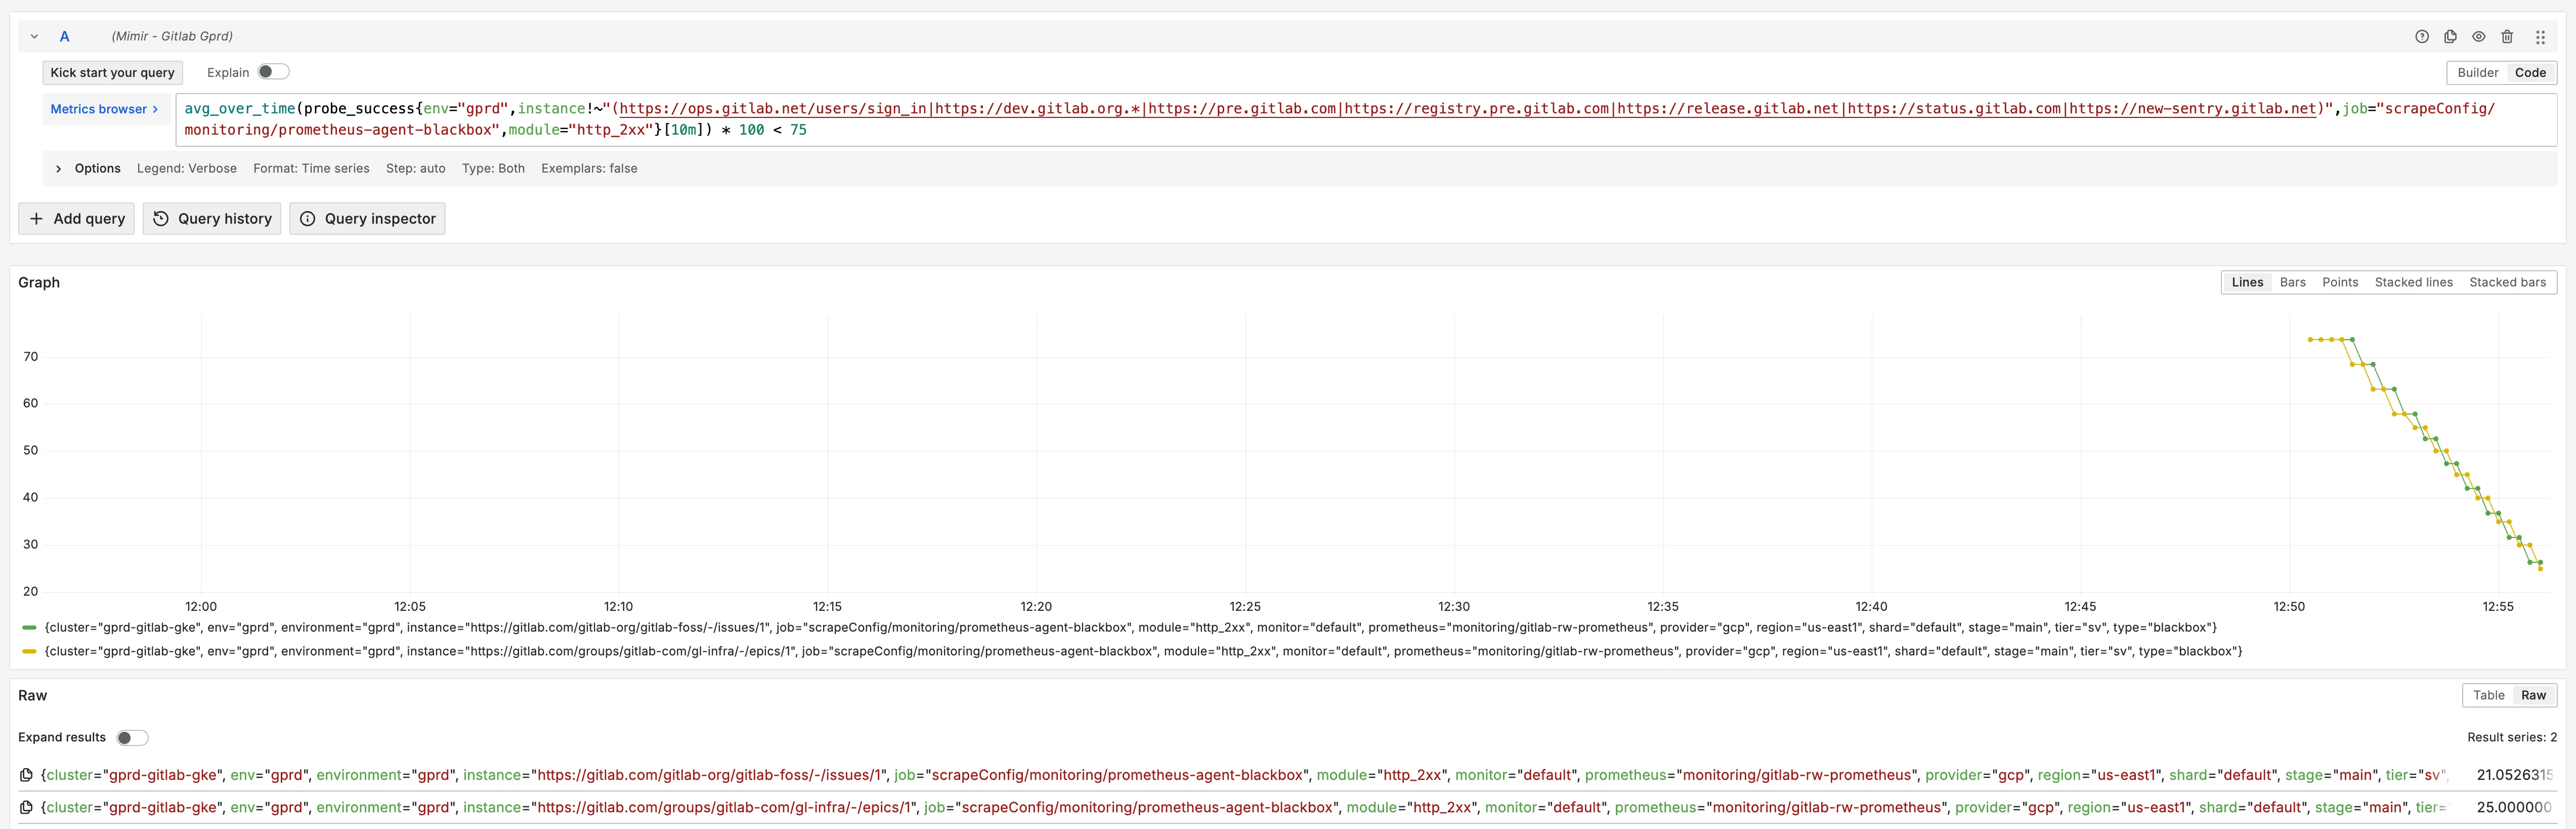
-
Example of the metric under normal conditions:
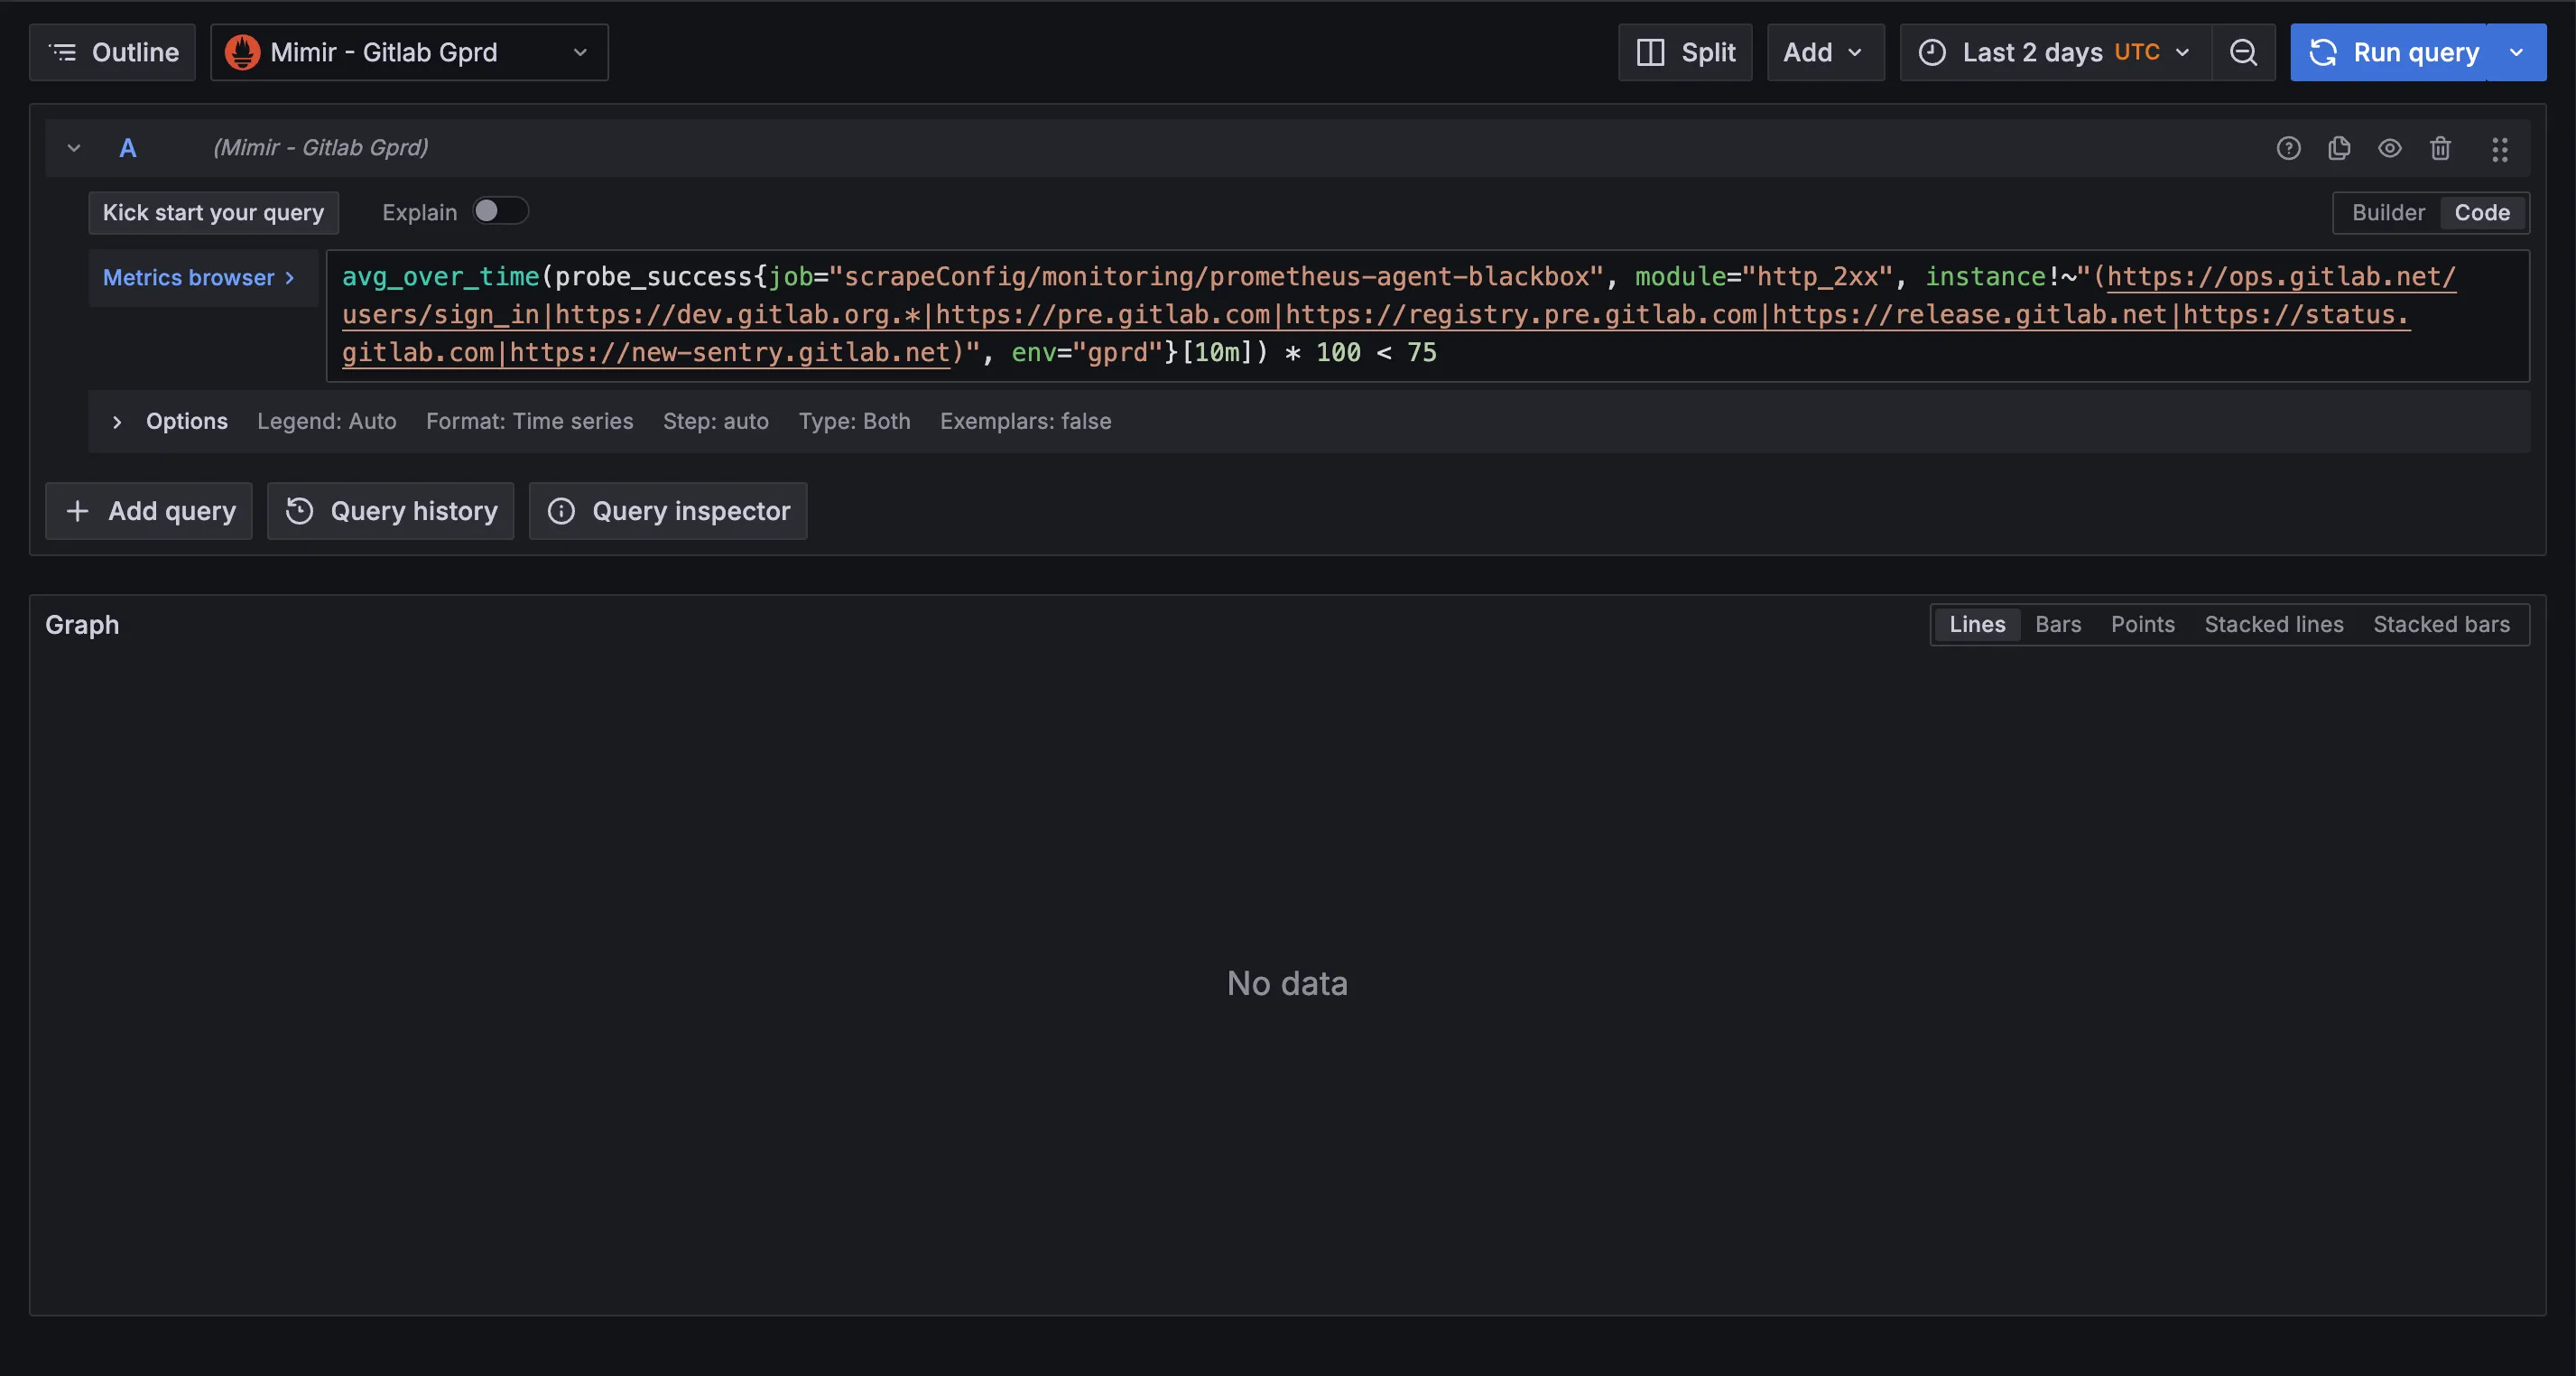
-
Any presence of a the metric below 75 shows some failures of the probes.
Alert Behavior
Section titled “Alert Behavior”-
We can silence this alert by going here, finding the
BlackboxProbeFailuresand click on silence option. Silencing might be required if the alerts is caused by an external dependency out of our control. -
This alert is fairly common, past hits can be seen here
Severities
Section titled “Severities”- The incident severity can range from Sev4 to Sev1 depending on the endpoint.
- The impact depends on the endpoint being affected, as failures on certain endpoints will impact our customers.
- [Handbook Link](../ https://handbook.gitlab.com/handbook/engineering/infrastructure-platforms/incident-management/#incident-severity) to better decide the severity of the incident.
Verification
Section titled “Verification”Recent changes
Section titled “Recent changes”- Recent Blackbox Production Change/Incident Issues
- Recent chef-repo Changes
- Recent k8s-workloads Changes
Troubleshooting
Section titled “Troubleshooting”-
The blackbox exporter keeps logs from failed probes in memory and exposes them over a web interface. You can access it by using port forwarding, and then navigating to
http://localhost:9115Terminal window ssh blackbox-01-inf-gprd.c.gitlab-production.internal -L 9115:localhost:9115Please note that the exporter will only keep up to 1000 results, and drop older ones. So make sure to grab these as quickly as possible, before they expire.
-
The troubleshooting process might differ depending on the endpoint that the blackbox probes failed for.
- A good place to start is to trying figure out if it is an internal or external dependency.
- A recent deployment could have caused this issue and a good place to confirm it would be checking the web service dashboard.
- The next step in that case would be to contact the release managers and disabling canary and blocking deployments due to the incident
- Check for GCP and Cloudflare outages reported on their public status pages to see if they coincide with the downtime.
-
Investors Relations (ir.gitlab.com) main troubleshoot documentation
-
For certificate expiry alerts, it may be helpful to refer to this runbook on certificates.
Possible Resolutions
Section titled “Possible Resolutions”Dependencies
Section titled “Dependencies”- The alert might trigger due to a variety of factors, such as: a GCP outage, Cloudflare event, expired SSL certificate, or a breaking change related to the endpoint.
Escalation
Section titled “Escalation”Slack channels to look for assistance: