Elastic
Quick start
Section titled “Quick start”Elastic related resources
Section titled “Elastic related resources”- Logging dashboard in Grafana
- runbooks repo:
- documentation
- Prometheus alerts
- dashboards/watchers/visualizations/searches
- terraform config:
- infra managed in the
gitlab-com-infrastructurerepo (e.g. pubsubbeat VMs, stackdriver exporter) - relevant terraform modules
- infra managed in the
- chef config
- Design documents in
www-gitlab-comrepo: TODO: link here design docs once they are ready - Logging working group: https://about.gitlab.com/company/team/structure/working-groups/log-aggregation/
- vendor issue tracker: https://gitlab.com/gitlab-com/gl-infra/elastic/issues
- Global Search engineering team
- Slack channel
#g_global_search - Discussions in different issues across multiple projects (e.g. regarding costs for indexing entire gitlab.com)
- Discussions in PM&Engineering meetings
Historical notes
Section titled “Historical notes”- esc-tools repo used for managing the ES5 cluster
How-to guides
Section titled “How-to guides”Administrative access/login
Section titled “Administrative access/login”We’ve locked down OKTA access to read only for both non-prod and prod logging clusters. Both clusters can still be accessed for read/write by SRE on-call through the [email protected] account.
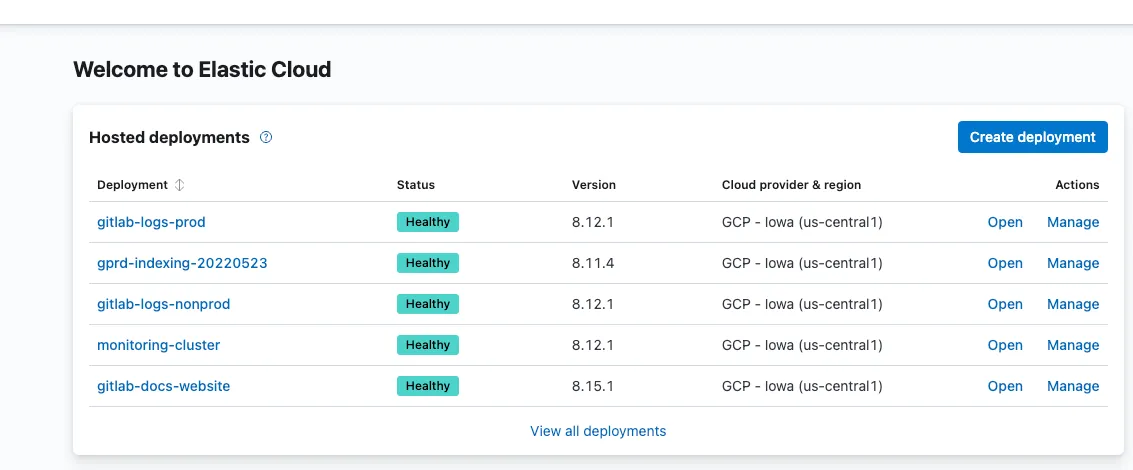
Once logged into Elastic Cloud, select ‘open’ for any of the clusters and you’ll be logged into Kibana as a super user.
Disaster recovery
Section titled “Disaster recovery”Upgrade checklist
Section titled “Upgrade checklist”Pre-flight
Section titled “Pre-flight”- Upgrade the version of Elasticsearch in CI
- Upgrade the version of Elasticsearch used in
gitlab-qanightly builds (we currently support latest version plus 1 older supported version) - Upgrade the version of Elasticsearch used in GDK
- Verify that there are no errors in the Staging or in the Production cluster and that both are healthy
- Verify that there are no alerts firing for the Advanced Search feature, Elasticsearch, Sidekiq workers, or redis
Upgrade Staging
Section titled “Upgrade Staging”- Confirm new Elasticsearch version works in CI with passing pipeline
- Pause indexing in Staging
GitLab > Admin > Settings -> General > Advanced Searchor through the console::Gitlab::CurrentSettings.update!(elasticsearch_pause_indexing: true) - Wait 2 mins for queues in redis to drain and for inflight jobs to finish
- Add a new comment to an issue and verify that the Elasticsearch queue increases in the graph
- In the Elastic Cloud UI, take a snapshot of the Staging cluster and note the snapshot name
- In Elastic Cloud UI, upgrade the Staging cluster to the desired version
- Wait until the rolling upgrade is complete
- Verify that the Elasticsearch cluster is healthy in Staging
- Go to GitLab.com Staging and test that searches across all scopes in the
gitlab-orggroup still work and return results. Note: We should not unpause indexing since that could result in data loss - Once all search scopes are verified, unpause indexing in Staging
GitLab > Admin > Settings -> General > Advanced Searchor through the console::Gitlab::CurrentSettings.update!(elasticsearch_pause_indexing: false) - Wait until the Sidekiq Queues (Global Search) have caught up
- Verify that the Advanced Search feature is working in Staging
Upgrade Production
Section titled “Upgrade Production”- Add a silence via https://alerts.gitlab.net/#/silences/new with a matcher on the following alert names (link the comment field in each silence back to the Change Request Issue URL)
alertname="SearchServiceElasticsearchIndexingTrafficAbsent"alertname="gitlab_search_indexing_queue_backing_up"
- Pause indexing in Production
GitLab > Admin > Settings -> General > Advanced Searchor through the console::Gitlab::CurrentSettings.update!(elasticsearch_pause_indexing: true) - Wait 2 mins for queues in redis to drain and for inflight jobs to finish
- Verify that the Elasticsearch queue increases in the graph
- In the Elastic Cloud UI, take a snapshot of the Production cluster and note the snapshot name
- In Elastic Cloud UI, upgrade the Production cluster to the desired version
- Wait until the rolling upgrade is complete
- Verify that the Elasticsearch cluster is healthy in Production
- Go to GitLab.com Production and test that searches across all scopes in the
gitlab-orggroup still work and return results. Note: We should not unpause indexing since that could result in data loss - Once all search scopes are verified, unpause indexing in Production
GitLab > Admin > Settings -> General > Advanced Searchor through the console::Gitlab::CurrentSettings.update!(elasticsearch_pause_indexing: false) - Wait until the Sidekiq Queues (Global Search) have caught up
- Verify that the Advanced Search feature is working in Production
Rollback steps
Section titled “Rollback steps”- If the upgrade completed but something is not working, create a new cluster and restore an older version of Elasticsearch from the snapshot captured above. Then update the credentials in
GitLab > Admin > Settings > General > Advanced Searchto point to this new cluster. The original cluster should be kept for root cause analysis. Keep in mind that this is a last resort and will result in data loss.
How to verify the Elasticsearch cluster is healthy
Section titled “How to verify the Elasticsearch cluster is healthy”- Verify the cluster is in a healthy state and that there are no errors in the Kibana cluster monitoring logs
- Verify that the
elasticsearch_exportercontinues to export metrics
How to verify that the Advanced Search feature is working
Section titled “How to verify that the Advanced Search feature is working”- Add a comment to an issue and then search for that comment. Note: that before the results show up, all jobs in the queue need to be processed and this can take a few minutes. In addition, refreshing of the Elasticsearch index can take another 30s (if there were no search requests in the last 30s).
- Search for a commit that was added after indexing was paused
Monitoring
Section titled “Monitoring”Metric: Search overview metrics
Section titled “Metric: Search overview metrics”- Location: https://dashboards.gitlab.net/d/search-main/search-overview?orgId=1
- What changes to this metric should prompt a rollback: Flatline of RPS
Metric: Search controller performance
Section titled “Metric: Search controller performance”- Location: https://dashboards.gitlab.net/d/web-rails-controller/web3a-rails-controller?orgId=1&var-PROMETHEUS_DS=mimir-gitlab-gprd&var-environment=gprd&var-stage=main&var-controller=SearchController&var-action=show
- What changes to this metric should prompt a rollback: Massive spike in latency
Metric: Search sidekiq indexing queues (Sidekiq Queues (Global Search))
Section titled “Metric: Search sidekiq indexing queues (Sidekiq Queues (Global Search))”- Location: https://dashboards.gitlab.net/d/sidekiq-main/sidekiq-overview?orgId=1
- What changes to this metric should prompt a rollback: Queues not draining
Metric: Search sidekiq in flight jobs
Section titled “Metric: Search sidekiq in flight jobs”- Location: https://dashboards.gitlab.net/d/sidekiq-shard-detail/sidekiq3a-shard-detail?orgId=1&var-PROMETHEUS_DS=mimir-gitlab-gprd&var-environment=gprd&var-stage=main&var-shard=elasticsearch
- What changes to this metric should prompt a rollback: No jobs in flight
Metric: Elastic Cloud outages
Section titled “Metric: Elastic Cloud outages”- Location: https://status.elastic.co/#past-incidents
- What changes to this metric should prompt a rollback: Incidents which prevent upgrade of the cluster
Performing operations on the Elastic cluster
Section titled “Performing operations on the Elastic cluster”One time Elastic operations should be documented as api_calls in this repo. Everything else, for example cluster config, index templates, should be managed using CI (with the exception of dashboards and visualizations created in Kibana by users).
The convention used in most scripts in api_calls is to provide cluster connection details using an env var called ES7_URL_WITH_CREDS. It has a format of: https://<es_username>:<password>@<cluster_url>:<es_port> . The secret that this env var should contain can be found in 1password.
Estimating Log Volume and Cluster Size
Section titled “Estimating Log Volume and Cluster Size”If we know how much log volume we are indexing per day, how many resources we are using on our cluster, the desired retention period and how much log volume we want to add, then we can estimate the needed cluster size.
Currently, fluentd is sending all logs to stackdriver and some logs to GCP PubSub. We have pubsubbeat nodes for each topic, sending the logs into elastic.
What is going to Stackdriver?
Section titled “What is going to Stackdriver?”Stackdriver is ingesting everything - around 50TiB per month as of 17-01-2020: Resources view
haproxy logs are send into a GCP sink instead of to pubsub/elastic because of their size (10MiB/s or 850GiB/day).
What is the Volume of our PubSub topics?
Section titled “What is the Volume of our PubSub topics?”Average daily pubsub volume per topic in GiB (base unit in prometheus is Byte/minute for this metric).
Same metric in Stackdriver metrics explorer (Byte/s)
Total of 1.3TiB/day as of 17-01-2020 (nginx being excluded).
How much elastic storage are we using per day?
Section titled “How much elastic storage are we using per day?”As we have one index alias per pubsub topic and in ES5 cluster (gitlab-production) we use a naming convention for
rolled-over indices to add the date and a counter, we can grep the elastic cat
api for each pubsub index alias and add together the size of all indices
belonging to the same alias with the same day in the name to get the daily index
volume. [../api_calls/single/get-index-stats-summary.sh]
is doing that for you.
The results as of 16-01-2020 are analyzed in this sheet.
We can conclude from this, that index volume (with one replica shard) is around 3 times the volume of the corresponding pubsub topic.
As of 17-01-2020 we are using ca. 4TiB elastic storage per day (only pubsub topics, excluding nginx). That means for a 7 day retention we consume around 28TiB storage. Adding nginx logs would increase that by 0.6TiB/day (15%), haproxy logs by 2.5TiB/day (63%).
Analyzing index mappings
Section titled “Analyzing index mappings”At the moment of writing, we utilize static mappings defined in this repository. Here are a few ideas for analysis of those mappings:
jsonnet elastic/managed-objects/lib/index_mappings/rails.jsonnet | jq -r 'leaf_paths|join(".")' | grep -E '\.type$' | wc -ljsonnet elastic/managed-objects/lib/index_mappings/rails.jsonnet | jq -r 'leaf_paths|join(".")' | grep -E '\.type$' | headjsonnet elastic/managed-objects/lib/index_mappings/rails.jsonnet | jq -r 'leaf_paths|join(";")' | grep -E ';type$' | awk '{ print $1, 1 }' | inferno-flamegraph > mapping_rails.svgConcepts
Section titled “Concepts”Elastic learning materials
Section titled “Elastic learning materials”Design Document (Elastic at Gitlab)
Section titled “Design Document (Elastic at Gitlab)”https://gitlab.com/gitlab-com/www-gitlab-com/merge_requests/23545 TODO: update this link once merged
Monitoring
Section titled “Monitoring”Because Elastic Cloud is running on infrastructure that we do not manage or have access to, we cannot use our exporters/Prometheus/Thanos/Alertmanager setup. For this reason, the best option is to use Elasticsearch built-in x-pack monitoring that is storing monitoring metrics in Elasticsearch indices. In production environment, it makes sense to use a separate cluster for storing monitoring metrics (if metrics were stored on the same cluster, we wouldn’t know the cluster is down because monitoring would be down as well).
When monitoring is enabled and configured to send metrics to another Elastic cluster, it’s the receiving clusters’ responsibility to handle metrics rotation, i.e. the receiving cluster needs to have retention configured. For more details see: https://www.elastic.co/guide/en/cloud/current/ec-enable-monitoring.html#ec-monitoring-retention and https://www.elastic.co/guide/en/elasticsearch/reference/current/monitoring-settings.html
Apart from monitoring using x-pack metrics + watches, we are also using a blackbox exporter in our infrastructure. It’s used for monitoring selected API endpoints, such as ILM explain API.
Alerting
Section titled “Alerting”Since we cannot use our Alertmanager, Elasticsearch Watches have to be used for alerting. They will be configured on the Elastic cluster used for storing monitoring indices.
Blackbox probes cannot provide us with sufficient granularity of state reporting.