Troubleshooting
Upgrading Sentry
Section titled “Upgrading Sentry”You should only attempt upgrades when the Sentry chart gets bumped. Some upgrades bring architectural changes which the chart should handle for us.
Minor upgrade
Section titled “Minor upgrade”Minor upgrades should not require database migrations, and incur little to no downtime.
- Open an MR bumping the chart version here.
- Check if there have been any new stanzas added to the base values file and add them to values file for the release if necessary.
- Review the release diff to look out for any potential breaking changes/downtime.
- Merge the MR and get it applied in
ops. - Helm will update the manifests and wait for pods to rotate.
- If the pods fail to rotate, look into the deployment pods and check the pod events for any errors, errors could come from the application itself, so check pod logs too.
Application errors will usually crop up in the
sentry-weborsentry-workerpods. - You can also restart the pods yourself by running
kubectl rollout restart deployment/sentry-weborkubectl rollout restart deployment/sentry-worker.
- If the pods fail to rotate, look into the deployment pods and check the pod events for any errors, errors could come from the application itself, so check pod logs too.
Application errors will usually crop up in the
- Double check that:
- The Sentry UI shows the new version number (in the footer)
- Running
sentry --versionin a shell on the web/worker pods should also return the new version number
Major upgrade
Section titled “Major upgrade”Major upgrades usually involve database migrations.
- Before opening any MRs, we need to ensure that the Postgres user Sentry uses for database access is granted superuser access.
- Forward port 5432 on the Cloud SQL proxy pod in the Sentry namespace to your local machine port 5432. The pod will usually be called something like
sentry-sql-proxy-gcloud-sqlproxy-... - Access the database via
psqlas thepostgresuser:psql -U postgres -d sentry(password can be found in 1Password under Ops Sentry Cloud SQL instance) - Grant
cloudsqlsuperuserrole access to the service account used by Sentry for DB access:grant cloudsqlsuperuser to "[email protected]"; - Exit.
- Forward port 5432 on the Cloud SQL proxy pod in the Sentry namespace to your local machine port 5432. The pod will usually be called something like
- Open an MR bumping the chart version here.
- Merge the MR and get it applied in
ops. - Helm will update the manifests and wait for pods to rotate.
- If the pods fail to rotate, look into the deployment pods and check the pod events for any errors, errors could come from the application itself, so check pod logs too.
Application errors will usually crop up in the
sentry-weborsentry-workerpods. - You can also restart the pods yourself by running
kubectl rollout restart deployment/sentry-weborkubectl rollout restart deployment/sentry-worker - If the hooks aren’t run (or don’t finish), you’ll need to run the migrations yourself:
- On one of the worker pods (which should already be running the new version of Sentry), bring up a shell and run
sentry upgrade. - On one of the
snuba-apipods, runsnuba migrations migrate.
- On one of the worker pods (which should already be running the new version of Sentry), bring up a shell and run
- You’ll know if migrations failed to run if you see errors in the Sentry UI complaining about version mismatches.
- If the pods fail to rotate, look into the deployment pods and check the pod events for any errors, errors could come from the application itself, so check pod logs too.
Application errors will usually crop up in the
- Revoke superuser access in the DB from the service account. Follow the same instructions above to login and access the DB as the
postgresuser, then runrevoke cloudsqlsuperuser from "[email protected]"; - Double check that:
- The Sentry UI shows the new version number (in the footer)
- Running
sentry --versionin a shell on the web/worker pods should also return the new version number
Event ingestion
Section titled “Event ingestion”If the stats page shows unexplained drops in event ingestion like this:
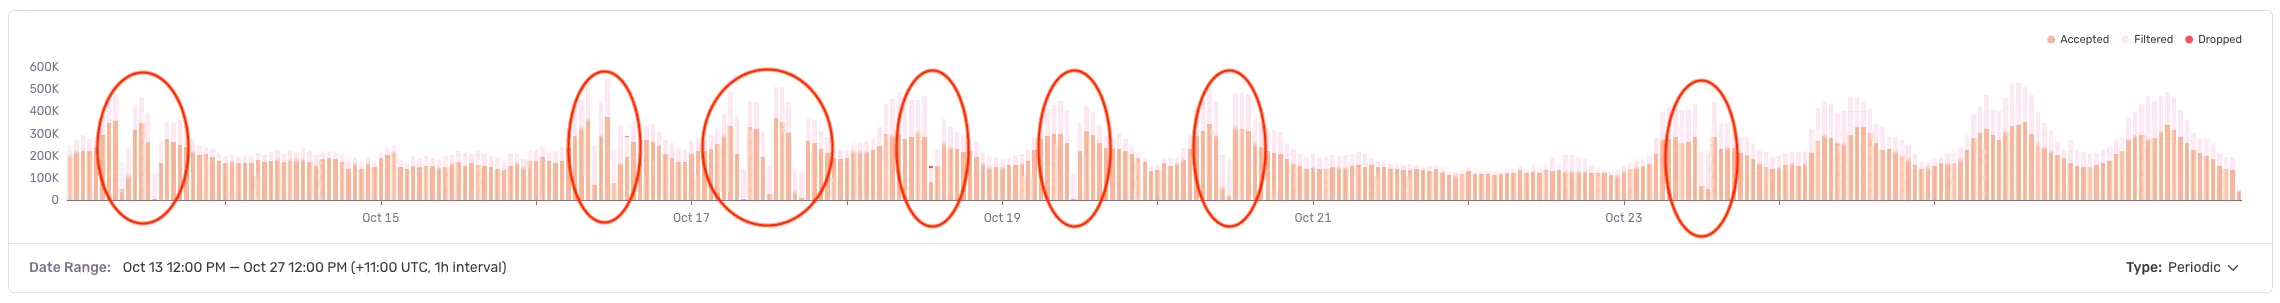
- Check CPU and memory utilisation on the Cloud SQL database. If CPU is pinned at 99%-100% at peak times then it will need more cores.
- Check if there are errors in Kafka. Refer to the section on Kafka for common errors and remediation steps.
- Also check that there is enough free space on the Kafka PVs.
- Check if there are errors in the Redis master pod.
Stats not reflecting new errors
Section titled “Stats not reflecting new errors”If the stats page looks like this:

Check if the Snuba outcomes consumers are stuck on something - tail their logs using k9s or by running kubectl logs deployment/sentry-snuba-outcomes-consumer --namespace=sentry. If you don’t see any logs (because they’re too old), try restarting the deployment: kubectl rollout restart deployment/sentry-snuba-outcomes-consumer --namespace=sentry.
OFFSET_OUT_OF_RANGE Broker: Offset out of range
Section titled “OFFSET_OUT_OF_RANGE Broker: Offset out of range”Surfaced as log messages like these in the affected consumer pods, which will also be crashlooping:
arroyo.errors.OffsetOutOfRange: KafkaError{code=_AUTO_OFFSET_RESET,val=-140,str="fetch failed due to requested offset not available on the broker: Broker: Offset out of range (broker 2)"}This means Kafka has gone out of sync with the consumers. According to the official docs, there are a number of reasons for this, but we’ve only previously run into this due to memory pressure.
The resolution does result in data loss! However it can’t be helped if the cluster isn’t processing anything due to this error.
-
Take note of what’s failing. For example, if the pods in deployment
sentry-ingest-consumer-eventsare crashlooping with the above log message, we know the relevant queue in Kafka would have something to do with theeventsingest-consumer.- You can also run
JMX_PORT="" /opt/bitnami/kafka/bin/kafka-consumer-groups.sh --bootstrap-server localhost:9092 --all-groups -describeto list all consumers and topics. Under normal circumstances, lag should ideally be well under 1000. A lag value in the tens of thousands or above is a sure sign something is wrong!
- You can also run
-
Scale down the problem deployment to 0.
-
Bring up a shell on one of the Kafka pods - doesn’t matter which, in this example we’ll just use
kafka-0. -
Check the status of the problematic consumer group (in this example,
ingest-consumeris our consumer group).I have no name!@sentry-kafka-0:/$ JMX_PORT="" /opt/bitnami/kafka/bin/kafka-consumer-groups.sh --bootstrap-server localhost:9092 --group ingest-consumer -describeGROUP TOPIC PARTITION CURRENT-OFFSET LOG-END-OFFSET LAG CONSUMER-ID HOST CLIENT-IDingest-consumer ingest-attachments 0 - 0 - rdkafka-18ac30b0-09db-40e5-b3f9-cf9e77bece92 /10.252.36.95 rdkafkaingest-consumer ingest-transactions 0 32204576 32204580 4 rdkafka-9020993b-f5f7-4b9e-8cd5-f7047f7a0672 /10.252.33.200 rdkafkaingest-consumer ingest-events 0 144444096 150079891 5635795 - - -The output above means that the
ingest-eventstopic currently has no consumers (since we scaled down the deployment to 0) and it’s very behind (large lag value). -
In order to properly recover, we also need to ensure there are no consumers active for the other topics in the consumer group. In this example we need to scale down the deployments for
sentry-ingest-consumer-attachmentsandsentry-ingest-consumer-transactionsto 0. Check that you’ve done this properly by rerunning the command to describe the consumer group above -CONSUMER-IDandHOSTshould be empty for theingest-attachmentsandingest-transactionstopics afterward.- Failing to do this will result in a log message like
Error: Assignments can only be reset if the group 'ingest-consumer' is inactive, but the current state is Stable.when you try and do the reset.
- Failing to do this will result in a log message like
-
Now we have to reset the offset of the problematic topic.
- Do a dry run to check what the new offset will be:
JMX_PORT="" /opt/bitnami/kafka/bin/kafka-consumer-groups.sh --bootstrap-server localhost:9092 --group ingest-consumer --topic ingest-events --reset-offsets --to-latest --dry-run - If the new offset looks acceptable, execute the reset:
JMX_PORT="" /opt/bitnami/kafka/bin/kafka-consumer-groups.sh --bootstrap-server localhost:9092 --group ingest-consumer --topic ingest-events --reset-offsets --to-latest --execute. The output should look something like:
GROUP TOPIC PARTITION NEW-OFFSETingest-consumer ingest-events 0 150082383 - Do a dry run to check what the new offset will be:
-
Scale the deployments you scaled down before back up. They should no longer be stuck printing errors.
Consumer lag increasing
Section titled “Consumer lag increasing”There are a few different reasons for this. Check the following:
-
Try restarting the deployment of consumers responsible for the group.
-
Is there enough free space on the Kafka data PVCs?
-
If Sentry was upgraded recently and everything else is working (i.e. Sentry appears to be processing events promptly and stats look fine), it may simply be deprecated queues that need to be cleaned up. For example:
Consumer group 'snuba-post-processor' has no active members.GROUP TOPIC PARTITION CURRENT-OFFSET LOG-END-OFFSET LAG CONSUMER-ID HOST CLIENT-IDsnuba-post-processor events 6 64784 64784 0 - - -snuba-post-processor transactions 0 4210372 4275501 65129 - - -snuba-post-processor events 2 25461 26568 1107 - - -snuba-post-processor transactions 4 4196411 4261798 65387 - - -snuba-post-processor events 8 151041068 154115234 3074166 - - -...As per this comment, the
snuba-post-processorgroup was actually removed, so we shouldn’t have this anymore. The ultimate fix here was to runJMX_PORT="" /opt/bitnami/kafka/bin/kafka-consumer-groups.sh --bootstrap-server localhost:9092 --group snuba-post-processor --delete -
We may not be processing messages fast enough on a particular topic. This can be because of normal growth or because of a sudden influx in a new error type. If it is due to normal growth, we will need to add partitions and consumers to that topic.
- Decide how many consumers you want on the topic, then modify
values.yamlso that thereplicaCountof the consumer group andTOPIC_PARTITION_COUNTS(underconfig.snubaSettingsPy) match the new number of consumers.- You cannot decrease the number of consumers (without a lot of work), only increase!
- Note that merging and deploying your changes at this stage doesn’t actually affect the number of partitions yet, only the replica count of the consumer group.
- If the consumers and partition counts don’t match, we’ll either have inactive consumers or one consumer processing messages from multiple partitions.
- Bring up a shell on one of the Kafka pods (doesn’t matter which).
- Run
JMX_PORT="" /opt/bitnami/kafka/bin/kafka-topics.sh --bootstrap-server localhost:9092 --topic <topic> --partitions <num-partitions> - Run
JMX_PORT="" /opt/bitnami/kafka/bin/kafka-consumer-groups.sh --bootstrap-server localhost:9092 --all-groups -describe. If the repartitioning was successful, you should see a message likeWarning: Consumer group 'snuba-consumers' is rebalancing.
- Decide how many consumers you want on the topic, then modify
-
If the issue is due to a sudden influx of errors, it’s possible to filter out specific errors..
- Log in as an admin user if you do not have admin access. Instructions are here.
- Go to the settings for the project that has the error. In most cases, it’s likely to be gitlabcom.
- In the customs filter section at the bottom, put in the full title of the error message (ex.
JWT::DecodeError: Not enough or too many segments (JWT::DecodeError).). There is no save button, to save you need to click out of that field and it will save.
Pods crashlooping with KafkaError: UNKNOWN_PARTITION
Section titled “Pods crashlooping with KafkaError: UNKNOWN_PARTITION”This occurs when a group/topic that a consumer is listening to disappears during a Helm upgrade for unknown reasons. You should be able to rectify this by:
- Bringing up a shell on one of the Snuba API pods
- Running
snuba migrations migrate --force
RabbitMQ
Section titled “RabbitMQ”RabbitMQ problems manifest themselves as AMQP error logs in the worker pods. For example, these errors started showing up after a borked update:
amqp.exceptions.PreconditionFailed: Queue.declare: (406) PRECONDITION_FAILED - inequivalent arg 'durable' for queue 'counters-0' in vhost '/': received 'false' but current is 'true'00:54:37 [CRITICAL] celery.worker: Unrecoverable error: PreconditionFailed(406, "PRECONDITION_FAILED - inequivalent arg 'durable' for queue 'counters-0' in vhost '/': received 'false' but current is 'true'", (50, 10), 'Queue.declare')Unfortunately the only way I could resolve this was to forcibly reset the RabbitMQ nodes, wiping the existing queues, so this should only be done as a last resort!
-
Bring up a shell on any RabbitMQ pod. RabbitMQ clusters don’t have leaders like in other systems so you can theoretically run the following commmands on any pod you like, as long as it’s part of the RabbitMQ cluster.
-
Stop the RabbitMQ app running on all pods in the cluster.
-
If I’m on the 3rd pod in a 3-pod cluster, the commands I need to run will look like this:
rabbitmqctl -n rabbit@sentry-rabbitmq-1.sentry-rabbitmq-headless.sentry.svc.cluster.local stop_apprabbitmqctl -n rabbit@sentry-rabbitmq-2.sentry-rabbitmq-headless.sentry.svc.cluster.local stop_apprabbitmqctl stop_app
-
-
Force reset all pods in the cluster.
-
In a similar 3-pod setup to above, I’d run:
rabbitmqctl -n rabbit@sentry-rabbitmq-1.sentry-rabbitmq-headless.sentry.svc.cluster.local force_resetrabbitmqctl -n rabbit@sentry-rabbitmq-2.sentry-rabbitmq-headless.sentry.svc.cluster.local force_resetrabbitmqctl force_reset
-
-
Restart all the pods in the cluster. They should discover each other automatically.
-
In a similar 3-pod setup to the above, I’d run:
rabbitmqctl start_apprabbitmqctl -n rabbit@sentry-rabbitmq-1.sentry-rabbitmq-headless.sentry.svc.cluster.local start_apprabbitmqctl -n rabbit@sentry-rabbitmq-2.sentry-rabbitmq-headless.sentry.svc.cluster.local start_app
-
-
Check that the cluster is back to normal by running
rabbitmqctl cluster_status