Postgresql troubleshooting
Dashboards
Section titled “Dashboards”All PostgreSQL dashboards can be found in the PostgreSQL Grafana Folder.
Some relevant dashboards:
-
Patroni Service Overview: patroni, patroni-ci, patroni-registry, patroni-sec
:new: As of October 2024, there are also new dashboards for Postgres performance analysis and troubleshooting:
- Postgres node performance overview (high-level)
- Postgres aggregated query performance analysis
- Postgres single query performance analysis
- Postgres wait events analysis
Some Useful Runbooks to help with troubleshooting:
- Runbook “High-level performance analysis and troubleshooting of a Postgres node”
- Runbook “SQL query analysis and optimization for Postgres”
- Runbook “Postgres wait events analysis (a.k.a. Active Session History; ASH dashboard)“
Availability
Section titled “Availability”Note: The legacy alerts
XIDConsumptionTooLow,XLOGConsumptionTooLowandCommitRateTooLowno longer exist. Database activity is now monitored through the autogenerated SLI traffic alerts:
PatroniServiceTransactionsPrimaryTrafficCessation/…TrafficAbsentPatroniServiceTransactionsReplicaTrafficCessation/…TrafficAbsentPatroniServiceClientDatabaseTransactionTrafficCessation/…TrafficAbsent
Defined in mimir-rules/gitlab-<env>/patroni/autogenerated-gitlab-<env>-patroni-service-level-alerts.yml.
These alerts measure activity on the database, not blackbox probes. A cessation or absence of traffic could mean the database is not responding, or that the application is having difficulty connecting to it.
Check:
-
Postgres error logs in Kibana (full disk or other I/O errors will normally not cause Postgres to shut down and may even allow read-only queries but will cause all read-write queries to generate errors).
-
Check that you can connect to the database from a psql prompt.
-
Check that you can connect to the database from the Rails console.
-
Check that you can make a database modification. Run
select txid_current()is handy for this as it does require disk i/o to record the transaction. You could also try creating and dropping a dummy table. -
Check other triage dashboards such as the cpu load and I/O metrics on the database host in question.
Errors
Section titled “Errors”Note: The legacy
RollbackRateTooHighalert has been replaced by the autogenerated error-SLI alerts:
PatroniServiceTransactionsPrimaryErrorSLOViolation(primary)PatroniServiceTransactionsReplicaErrorSLOViolation(replica)
Defined in mimir-rules/gitlab-<env>/patroni/autogenerated-gitlab-<env>-patroni-service-level-alerts.yml.
These alerts fire when the ratio of rollbacks to commits is too high. They
may not indicate a database problem, since rollbacks are frequently caused
by an application issue. First identify the affected node (fqdn) from the
alert labels.
Check the database error logs
Section titled “Check the database error logs”Resource starvation (full disk, out of memory, exhausted file descriptors) lets Postgres keep serving read-only queries while every read-write transaction rolls back.
-
Open the Postgres logs in Kibana, narrow to the affected node (filter on
fqdn), and search the message text forFATAL,PANIC, orERROR. -
Look for the signatures of resource starvation:
- Full disk / I/O:
No space left on device,could not extend file,could not write to file - Out of memory:
out of memory,cannot allocate memory - File descriptors:
too many open files - Lock/timeout-driven rollbacks:
deadlock detected,canceling statement due to statement timeout,could not serialize access
- Full disk / I/O:
-
If the logs point to host-level starvation, confirm on the node directly:
Terminal window df -h /var/opt/gitlab/postgresql # disk spacefree -m # memory
Check that the host is under normal load
Section titled “Check that the host is under normal load”Abnormally low activity (e.g. from replication lag or a network issue) can produce a false positive, so compare the node against its baseline on the PostgreSQL Overview and Postgres node performance overview dashboards.
If load looks normal and the logs are clean, the rollbacks are most likely
application-driven — correlate against pg_stat_activity,
pg_stat_statements, and the Rails/Sidekiq logs to find the offending
queries.
Note: The legacy
PostgresTooManyRowExclusiveLocksalert no longer exists (there is no alert specifically onpg_locks/RowExclusiveLock). Lock pressure is now alerted by:
component_saturation_slo_out_of_bounds:pg_wait_sampling_lock_manager(LWLock:LockManagerwait-event saturation)PatroniSubtransControlLocksDetected(subtransaction control locks)
Defined in mimir-rules/gitlab-<env>/patroni/autogenerated-gitlab-<env>-patroni-saturation-alerts.yml.
A large number of RowExclusiveLock records in pg_locks is often not
indicative of a problem, especially if they’re caused by inserts rather
than updates or deletes, or if they’re short-lived. But updates or deletes
that are not committed for a significant amount of time can cause
application issues.
Look for blocked queries or application latency.
Remediation can involve tracking down a rogue migration and killing or pausing it.
Note: The legacy
DBHeavyLoadOS-load alert no longer exists. CPU pressure on the primary database node is now alerted by:
PrimaryDatabaseCPUSaturation(cause alert; CPU pressure over three standard deviations above average) — dedicated runbook: Primary Database Node CPU Saturationcomponent_saturation_slo_out_of_bounds:pg_primary_cpu/:single_node_cpu/:cpu(generic per-node CPU saturation)
Defined in mimir-rules/gitlab-<env>/<service>/autogenerated-gitlab-<env>-<service>-patroni-saturation-alerts.yml.
When load is high, look for a large number of active backends running poorly optimized queries such as sorting large result sets or missing join clauses.
Don’t forget to look for generic Unix problems that can cause high load such as a broken disk (with processes getting stuck in disk-wait) or some administrative task such as mlocate or similar forking many child processes.
High (and similar) load on multiple hosts
Section titled “High (and similar) load on multiple hosts”It’s also possible for high load to be caused by out of date query statistics. For example, in https://gitlab.com/gitlab-com/gl-infra/production-engineering/-/issues/4429 we discovered that incorrect statistics for the “namespaces” table lead to an increase in sequential scans on the “issues” table.
Typically problems like this will produce graphs like the following:
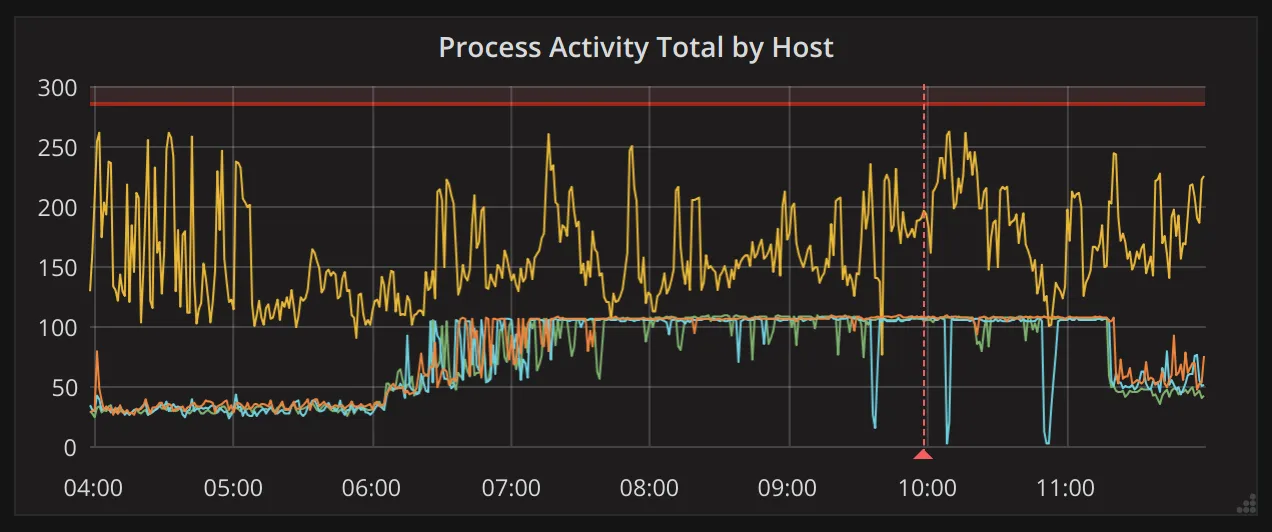
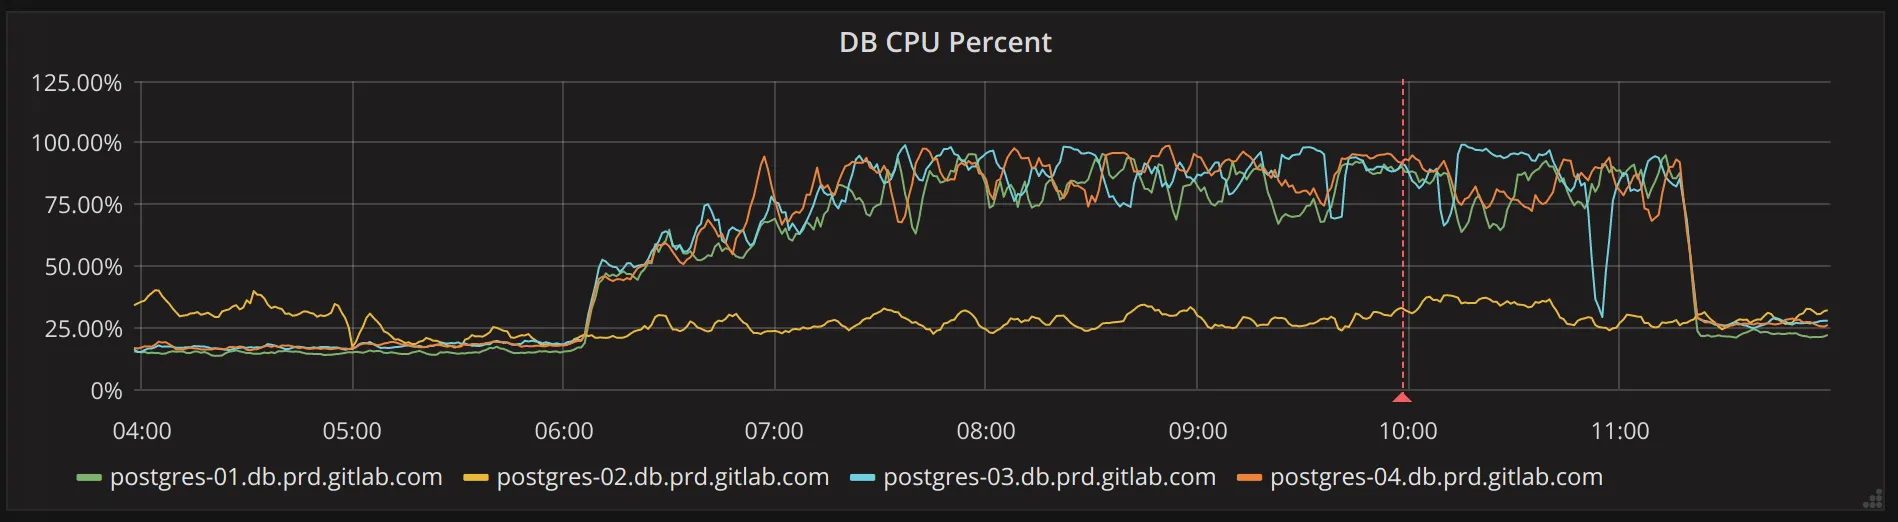
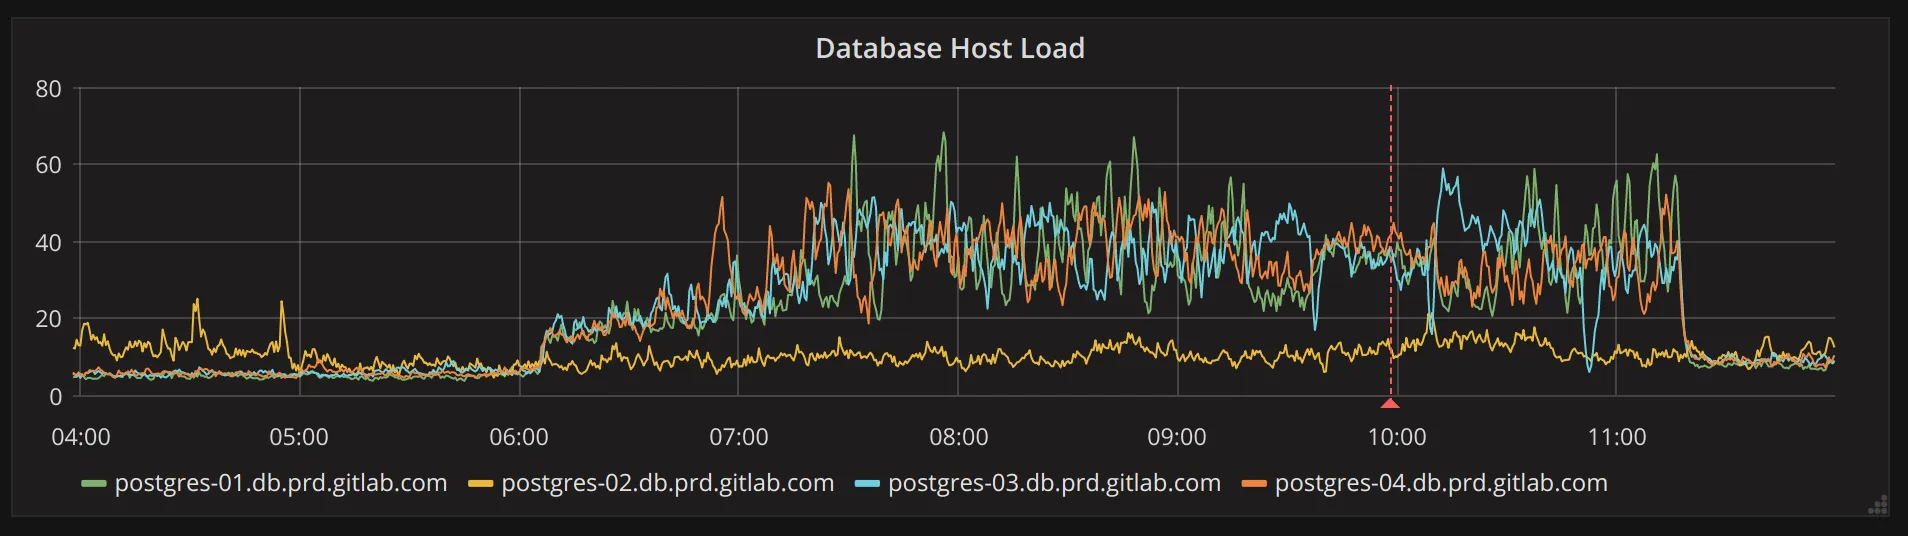
If you happen to know which table has out-of-date or incorrect statistics, you can run the following on the primary to resolve this:
ANALYZE VERBOSE table_name_here;However, it’s not unlikely that other tables are affected as well, which may
lead one to believe the problem lies elsewhere. To figure this out you will need
a few query plans of (now) badly behaving queries, then look at the tables these
queries use. Once you have identified potential candidates, you can ANALYZE
those tables. Alternative, you can run the following SQL query on the primary:
(run inside sudo gitlab-psql)
SELECT schemaname, relname, last_analyze, last_autoanalyze, last_vacuum, last_autovacuumFROM pg_stat_all_tablesORDER BY last_analyze DESC;This will list all tables, including the time ANALYZE last ran for the table.
Look for tables that have not been analysed for a long time, but should have
been. Keep in mind that ANALYZE may run only every now and then, if a table is
not updated very frequently. In other words, a high last_analyze or
last_autoanalyze value is not a guarantee that the table has incorrect
statistics.
A more drastic and easier approach is to simply re-analyze all tables. This won’t impact a running system, but this can take around 15 minutes to complete, depending on the table sizes. To perform this operation, run the following on the primary:
(run inside sudo gitlab-psql)
SET statement_timeout TO 0;ANALYZE VERBOSE;Replication is lagging or has stopped
Section titled “Replication is lagging or has stopped”Symptoms
Section titled “Symptoms”Note: The legacy streaming-replication alerts (“replication stopped”, “lag over 2min/120m”, “lag over 200MB”) no longer exist (pending re-introduction via production-engineering#25280; lag survives only as the recording rule
postgres:pg_replication_lag_bytes). Replication is now alerted by:
PostgresSplitBrain(more than one primary)PatroniIsDown(Patroni process/endpoint is down)PatroniConsulMultipleMaster(more than one node claims master in Consul)SiphonLogicalReplicationSlotLagHigh(logical replication slot lag, Siphon-specific)
Defined in mimir-rules/gitlab-<env>/patroni/patroni.yml and mimir-rules/gitlab-<env>/patroni/autogenerated-gitlab-<env>-patroni-siphon-replication-lag-alerts.yml.
Streaming-replica health is also covered indirectly by the SLI traffic alerts
PatroniServiceTransactionsReplicaTrafficCessation / …TrafficAbsent.
Alerts that can lead to replication problems:
- Disk saturation:
component_saturation_slo_out_of_bounds:disk_spaceand the predictiveComponentResourceRunningOut_disk_space(dedicated runbook: filesystem_alerts). - WAL/XLOG generation:
PrimaryDatabaseWALGenerationSaturationSpikeandPrimaryDatabaseWALGenerationSaturationSustainedOver150MBS(dedicated runbook: Primary Database Node WAL Generation Saturation). - WAL-sender (streaming) CPU:
component_saturation_slo_out_of_bounds:pg_walsender_cpu.
Possible checks
Section titled “Possible checks”-
Check replication lag on the PostgreSQL Replication Overview dashboard, or query it in Grafana Explore (Mimir datasource):
pg_replication_lag{env="gprd", type="patroni"} AND pg_replication_is_replica == 1 -
Also check for bloat (see the section “Tables with a large amount of dead tuples” below). Replication lag can cause bloat on the primary due to “vacuum feedback” which we have enabled.
-
If a replica is falling behind, the primary might keep WAL files around that are needed to catch up. This can lead to running out of disk space pretty fast! If things don’t resolve, remove the replication slot on the primary (see below)
-
Check if there’s a significant increase in writes in the Tuple Stats dashboard.
-
Check
pg_stat_activity_marginalia_sampler_active_countin Grafana Explore (Mimir datasource) for possible leads on which endpoint may be making the database busy:sum by (endpoint, fqdn, environment) (avg_over_time(pg_stat_activity_marginalia_sampler_active_count{env="gprd", fqdn=~"patroni-.*"}[1m]))
-
-
Note that as replicas in the pool become outdated, all read workload will be shifted to whichever replicas remaining that are not lagging. Replicas dropping out of the pool would lead to increased load on the primary.
Resolution
Section titled “Resolution”Look into whether there’s a particularly heavy migration running which may be generating very large WAL traffic that the replication can’t keep up with.
Compare rate(pg_xlog_position_bytes[1m]) with pg_replication_lag to see
if the replication lag is correlated with unusually high WAL generation and
what time it started. Run both in Grafana Explore
(Mimir datasource):
Query A — replication lag (replicas):
pg_replication_lag{env="gprd", type="patroni"} AND pg_replication_is_replica == 1Query B — WAL generation rate:
rate(pg_xlog_position_bytes{env="gprd", type="patroni"}[1m])Another cause of replication lag to investigate is a long-running query on the replica which conflicts with a vacuum operation from the primary. This should not be common because we don’t generally run many long-running queries on gitlab.com and we have vacuum feedback enabled.
Just wait, replication self recovers :wine_glass:
If it takes too long, kill the blocking query: terminate_slow_queries.sh
If a blocking query is not the cause, you may consider using load balancer feature flags to alter the amount of replication lag we tolerate for replica queries in order to prevent a site wide outage.
These two ops feature flags influence the application database load balancer to use replicas that would normally not be used due to their replication lag time exceeding max_replication_lag_time.
One doubles max_replication_lag_time, and the other ignores it completely.
The intent is for them to be used to prevent an outage in the event the replicas cannot keep up with the WAL rate and the primary becomes saturated without available replicas.
load_balancer_double_replication_lag_timeshould be tried first.load_balancer_ignore_replication_lag_timeshould be a last resort.
You can also look for any sidekiq workers that do a lot of inserts, udpates, or deletes. They can be deferred using chatops as described in Deferring Sidekiq jobs.
Replication Slots
Section titled “Replication Slots”Symptoms
Section titled “Symptoms”An unused replication slot in a primary will cause the primary to keep around a
large and growing amount of WAL (XLOG) in pg_wal/. This can eventually cause
low disk space free alerts and even an outage.
Possible checks
Section titled “Possible checks”- Look in
select * from pg_replication_slots where NOT active, for both the primary and the secondaries.
Resolution
Section titled “Resolution”Verify that the slot is indeed not needed any more. Note that after dropping the slot Postgres will be free to delete the WAL data that replica would have needed to resume replication. If it turns out to be needed that replica will likely have to be resynced using wal-e/wal-g or recreated from scratch.
Drop the replication slot with SELECT pg_drop_replication_slot('slot_name');
It’s possible for a secondary to have one or more inactive replication slots. In
this case the xmin value in pg_replication_slots on the primary may start
lagging behind. This in turn can prevent vacuuming from removing dead tuples.
This can be solved by dropping the replication slots on the secondaries.
Tables with a large amount of dead tuples
Section titled “Tables with a large amount of dead tuples”Symptoms
Section titled “Symptoms”Note: There is currently no alert on the dead-tuple count (
pg_stat_user_tables_n_dead_tup). Bloat resulting from dead tuples is instead covered by the saturation alerts:
component_saturation_slo_out_of_bounds:pg_table_bloatcomponent_saturation_slo_out_of_bounds:pg_btree_bloat
Defined in mimir-rules/gitlab-<env>/patroni/autogenerated-gitlab-<env>-patroni-saturation-alerts.yml.
Alerts that detect conditions which lead to dead-tuple bloat, and link here:
PatroniXminAgeTooLarge(xmin horizon too old — a stale replication-slot xmin is one cause;pg_txid_xmin_age > 500000) — defined inmimir-rules/gitlab-<env>/patroni/patroni.yml; runbook: patroni/pg_xid_xmin_age_alert.PatroniLongRunningTransactionDetected(long-lived transaction;pg_stat_activity_marginalia_sampler_max_tx_age_in_seconds > 540) — defined inmimir-rules/gitlab-<env>/autogenerated-gitlab-<env>-patroni-cause-alerts.yml; runbook: patroni/alerts/PatroniLongRunningTransactionDetected.
Possible Checks
Section titled “Possible Checks”Check on Grafana dashboards, in particular the “PostgreSQL Tuple Statistics” and the “Vacumming” and “Dead Tuples” tabs. Note that this is currently only visible on the internal dashboards
In the “Autovacuum Per Table” chart expect project_mirror_data and
ci_runners to be showing about 0.5 vacuums per minute and other
tables well below that. If any tables are much over 0.5 that’s not
good. If any tables are near 1.0 (1 vacuum per minute is the max our
settings allow autovacuum to reach) then that’s very bad.
In the “Dead Tuple Rates” and “Total Dead Tuples” expect to see a lot of fluctations but no trend. If you see “Total Dead Tuples” rising over time (or peaks that are rising each time) for a table then autovacuum is failing to keep up.
To find the tables with the most dead tuples, run
sort_desc(pg_stat_user_tables_n_dead_tup) in
Grafana Explore (Mimir datasource)
to see what the top offenders are. Note that sometimes when one table has
this problem there are other tables not far behind.
Check that statistics are up to date for those offenders:
Log into the primary and check that statistics are present. If logging in
through the console server, use (your_username)-db-primary@console....
(your_username)-db@console... will give you a secondary. In case the
primary has changed and the console server doesn’t know the new location yet,
it may be necessary to identify the primary and log in directly.
If the below query does not yield any results for a particular table,
consider running ANALYZE $table to update statistics and try again.
Example for table ci_builds (run inside sudo gitlab-psql):
select n_live_tup, n_dead_tup, last_autoanalyze, last_analyze frompg_stat_user_tables where relname='ci_builds';If the alert is for “replication slot with stale xmin” or “long-lived transaction” then check the above charts to see if it’s already causing problems. Log into the relevant replica and run
(inside sudo gitlab-psql):
SELECT now()-xact_start,pid,query,client_addr,application_name FROM pg_stat_activity WHERE state != 'idle' AND query NOT LIKE 'autovacuum%' ORDER BY now()-xact_start DESC LIMIT 3;There are any of three cases to check for:
- There’s a large number of dead tuples which vacuum is being ineffective at cleaning up due to a long-lived transaction (possibly on a replica due to “replication slot with a stale xmin”).
- There’s a large rate of dead tuples being created due to a run-away migration or buggy controller which autovacuum cannot hope to keep up with.
- There’s a busy table that needs specially tuned autovacuum settings to vacuum it effectively.
If there’s a deploy running or recent deploy with background migrations running then check for a very high “Deletes” or “Updates” rate on a table. Also check for for signs of other problems such as replication lag, high web latency or errors, etc.
If the problem is due to a migration and the dead tuples are high but not growing and it’s not causing other problems then it can be a difficult judgement call whether the migratin should be allowed to proceed. Migrations are a generally a one-off case-by-case judgement.
If the “Total Dead Tuples” is increasing over time then canceling the migration and reverting the deploy is probably necessary. Similarly if the source of the dead tuple thrashing is determined to be from a buggy web or api endpoint (or if it can’t be determined at all.)
Connections
Section titled “Connections”This could indicate a problem with the pgbouncer setup as it’s our primary mechanism for concentrating connections. It should be configured to use a limited number of connections.
Also check pg_stat_activity to look for old console sessions or
non-pgbouncer clients such as migrations or deploy scripts. Look in
particular for idle or idle in transaction sessions or sessions
running very long-lived queries.
e.g.:
(run inside sudo gitlab-psql)
SELECT pid, age(backend_start) AS backend_age, age(xact_start) AS xact_age, age(query_start) AS query_age, state, query FROM pg_stat_activity WHERE pid <> pg_backend_pid()Also, FYI “prepared transactions” and replication connections both contribute to connection counts. There should be zero prepared transactions on gitlab.com and only a small number of replication connections (2 currently).
PGBouncer Errors
Section titled “PGBouncer Errors”Note: Client-connection exhaustion (
no more connections allowed (max_client_conn)) is alerted by the saturation alerts:
component_saturation_slo_out_of_bounds:pgbouncer_client_conn_primary_main(primary; one per service — also…_primary_ci,…_primary_registry,…_primary_sec)component_saturation_slo_out_of_bounds:pgbouncer_client_conn_replicas(Patroni replicas)
Defined in mimir-rules/gitlab-<env>/pgbouncer[-<service>]/autogenerated-gitlab-<env>-pgbouncer[-<service>]-saturation-alerts.yml (primary, one file per service) and mimir-rules/gitlab-<env>/patroni[-<service>]/autogenerated-gitlab-<env>-patroni[-<service>]-saturation-alerts.yml (replicas).
These compare pgbouncer_used_clients against the configured max_client_conn. Application error-rate is covered separately by PatroniServicePgbouncerErrorSLOViolation.
When the number of incoming connections from all clients is larger than
max_client_conn, PGBouncer refuses new connections. PGBouncer runs on the
patroni fleet; the alert should tell you which host triggered it. If this
is the main patroni node, this means all connections from all processes and
threads on all hosts.
You can raise the max_client_conn temporarily by logging into the
pgbouncer console and issuing a command. First verify that the ulimit -n is high enough using prlimit (which can also set it). And get the
password for pgbouncer console from 1password under Production - gitlab and Postgres pgbouncer user:
# ps auxww |grep bin[/]pgbouncergitlab-+ 109886 34.4  0.6  28888 12836 ?        Rs   Mar19 13929:17 /opt/gitlab/embedded/bin/pgbouncer /var/opt/gitlab/pgbouncer/pgbouncer.ini
# prlimit -n -p 109886RESOURCE DESCRIPTION               SOFT  HARD UNITSNOFILE   max number of open files 50000 50000
$ sudo pgb-console
pgbouncer=# show config;            key            |                           value                            | changeable---------------------------+------------------------------------------------------------+------------ max_client_conn           | 2048                                                       | yes...
pgbouncer=# show pools;          database           |   user    | cl_active | cl_waiting | sv_active | sv_idle | sv_used | sv_tested | sv_login | maxwait |  pool_mode-----------------------------+-----------+-----------+------------+-----------+---------+---------+-----------+----------+---------+------------- gitlabhq_production         | gitlab    |       925 |          0 |        50 |      50 |       0 |         0 |        0 |       0 | transaction gitlabhq_production         | pgbouncer |         0 |          0 |         0 |       0 |       1 |         0 |        0 |       0 | transaction gitlabhq_production_sidekiq | gitlab    |      1088 |          0 |        56 |      69 |       0 |         0 |        0 |       0 | transaction gitlabhq_production_sidekiq | pgbouncer |         0 |          0 |         0 |       1 |       0 |         0 |        0 |       0 | transaction pgbouncer                   | pgbouncer |         1 |          0 |         0 |       0 |       0 |         0 |        0 |       0 | statement(5 rows)
pgbouncer=# set max_client_conn=4096;
Note in the above show pools command the cl_active column lists a
total of 2013 active client connections (not including our
console). Just 35 short of the max_client_conn of 2048.
If this is an alert for any other error you’re on your own. But be aware that it could be caused by something mundane such as an admin typing commands at the console generating “invalid command” errors or the database server restarting or clients dying.
Sentry - Postgres pending WAL files on primary is high
Section titled “Sentry - Postgres pending WAL files on primary is high”Check the Runbook sentry.