performance-degradation-troubleshooting
Troubleshooting database (postgres/pgbouncer) degradation
Section titled “Troubleshooting database (postgres/pgbouncer) degradation”Database performance degradation may be due to several reasons. To search for the root cause, you can start digging by checking existing metrics.
Check CPU utilization
Section titled “Check CPU utilization”You can use this metric to check CPU utilization over the patroni hosts:
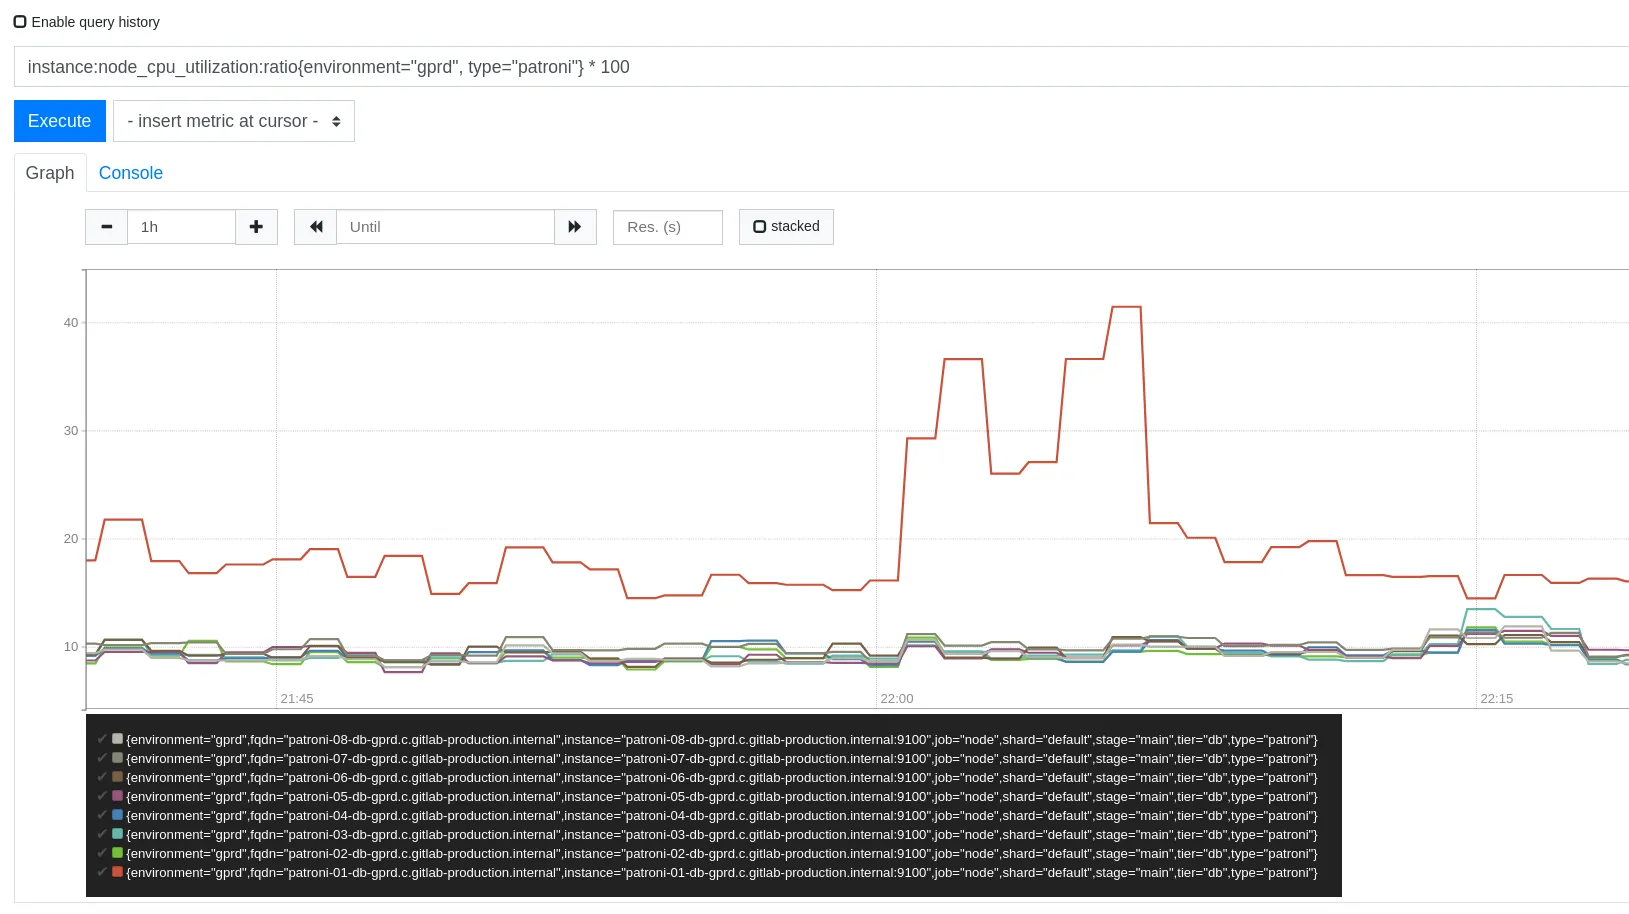
Check if values are getting close to 1
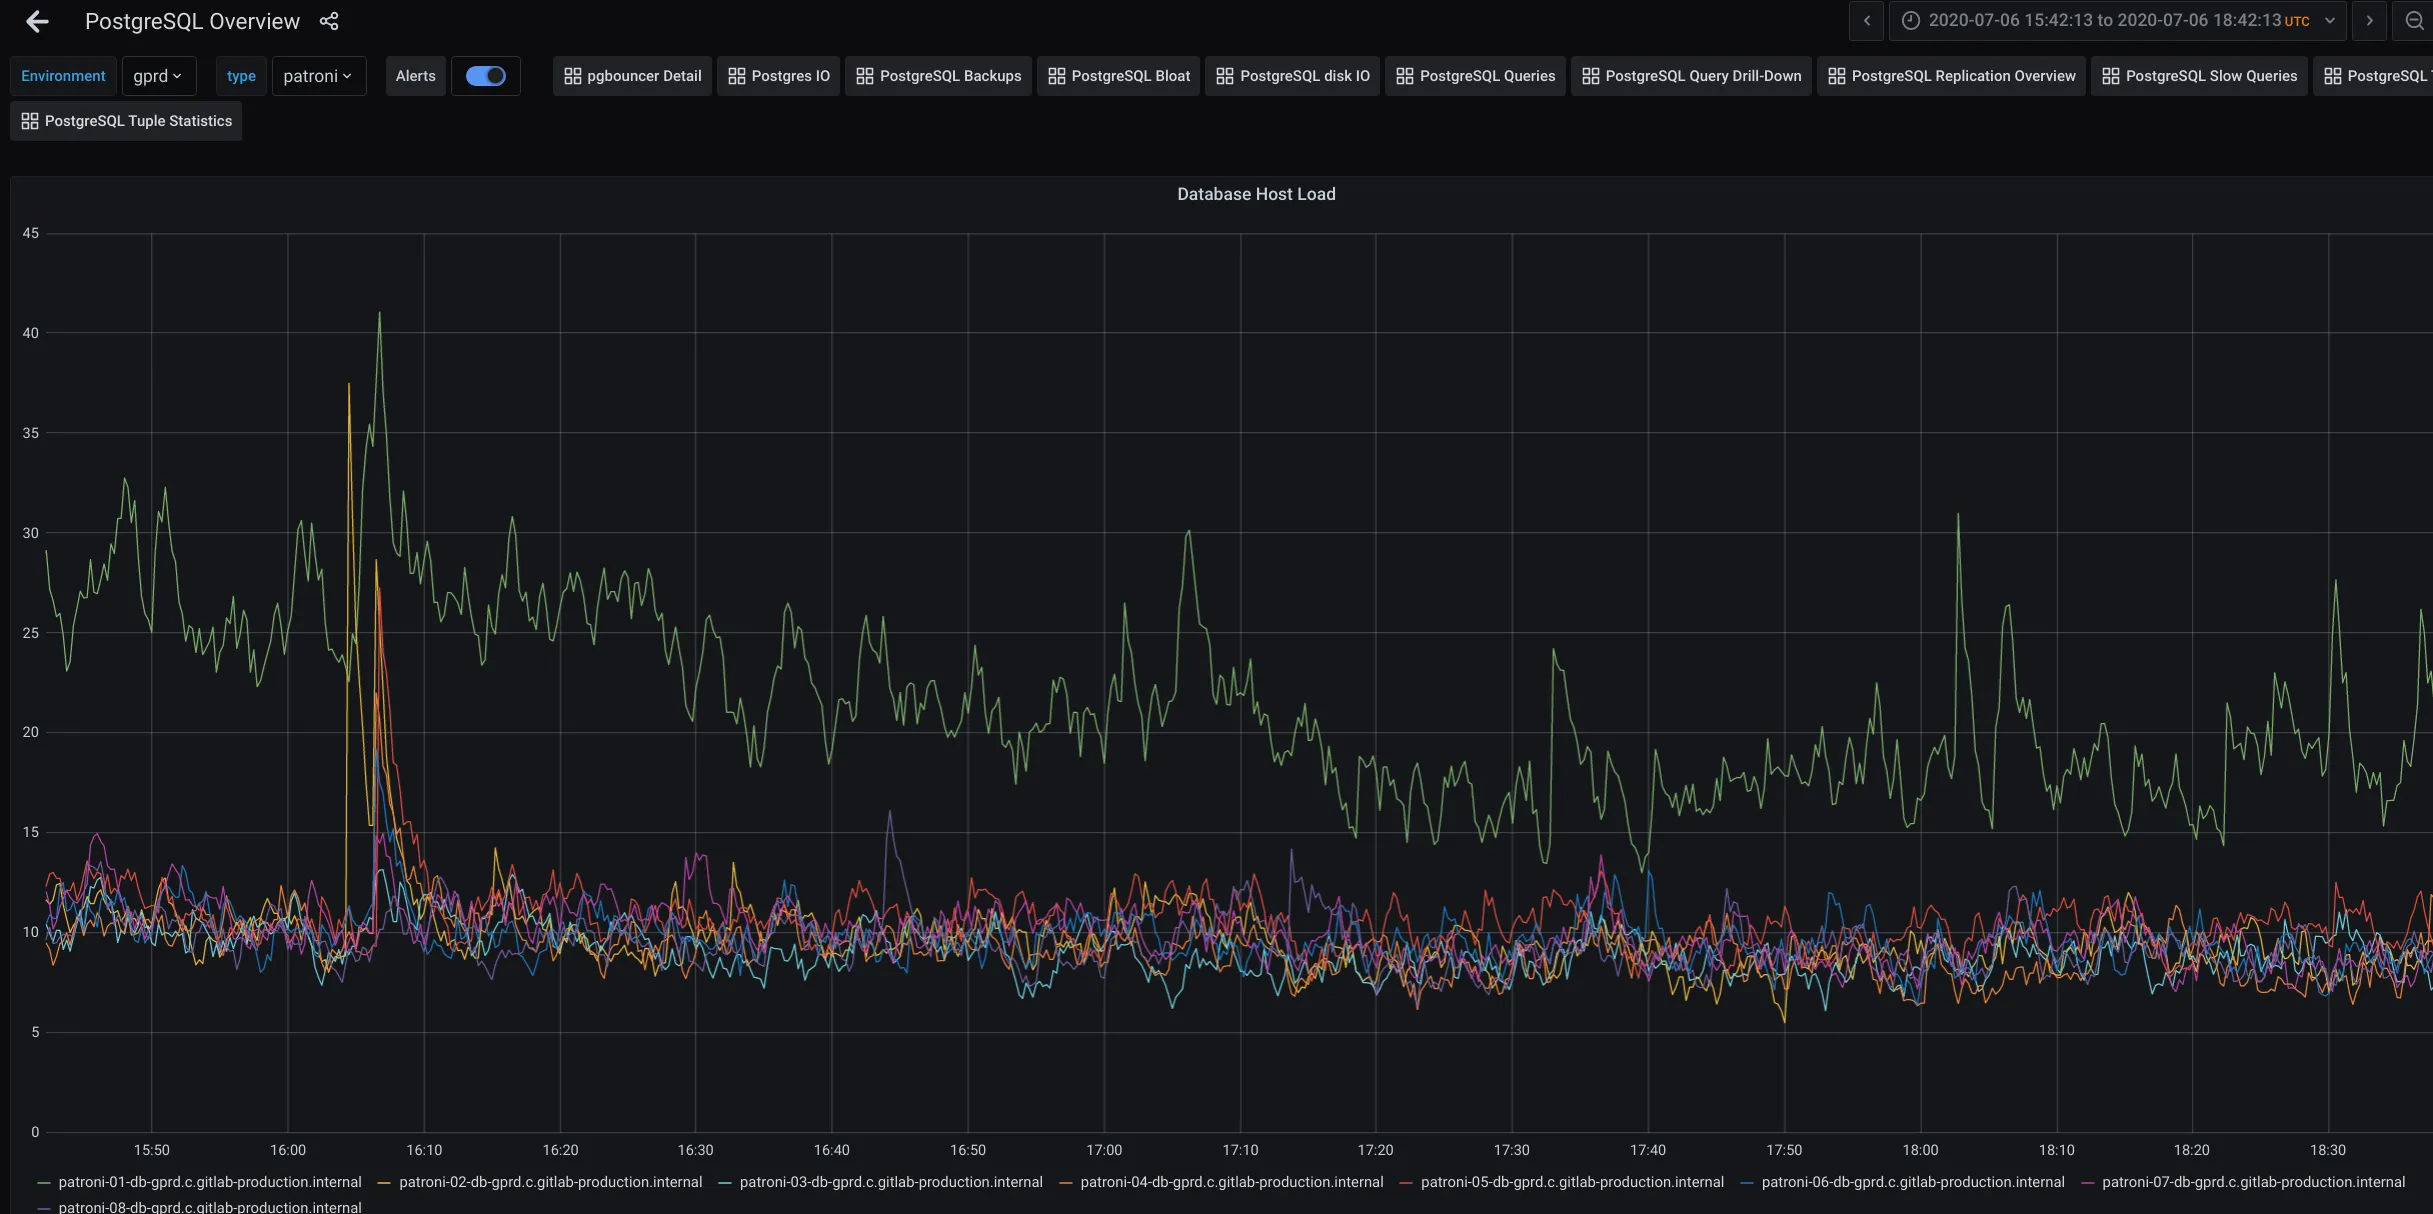
You can also take a look on this graph - part of the Patroni Overview panel - to check the host load.
Check for memory utilization
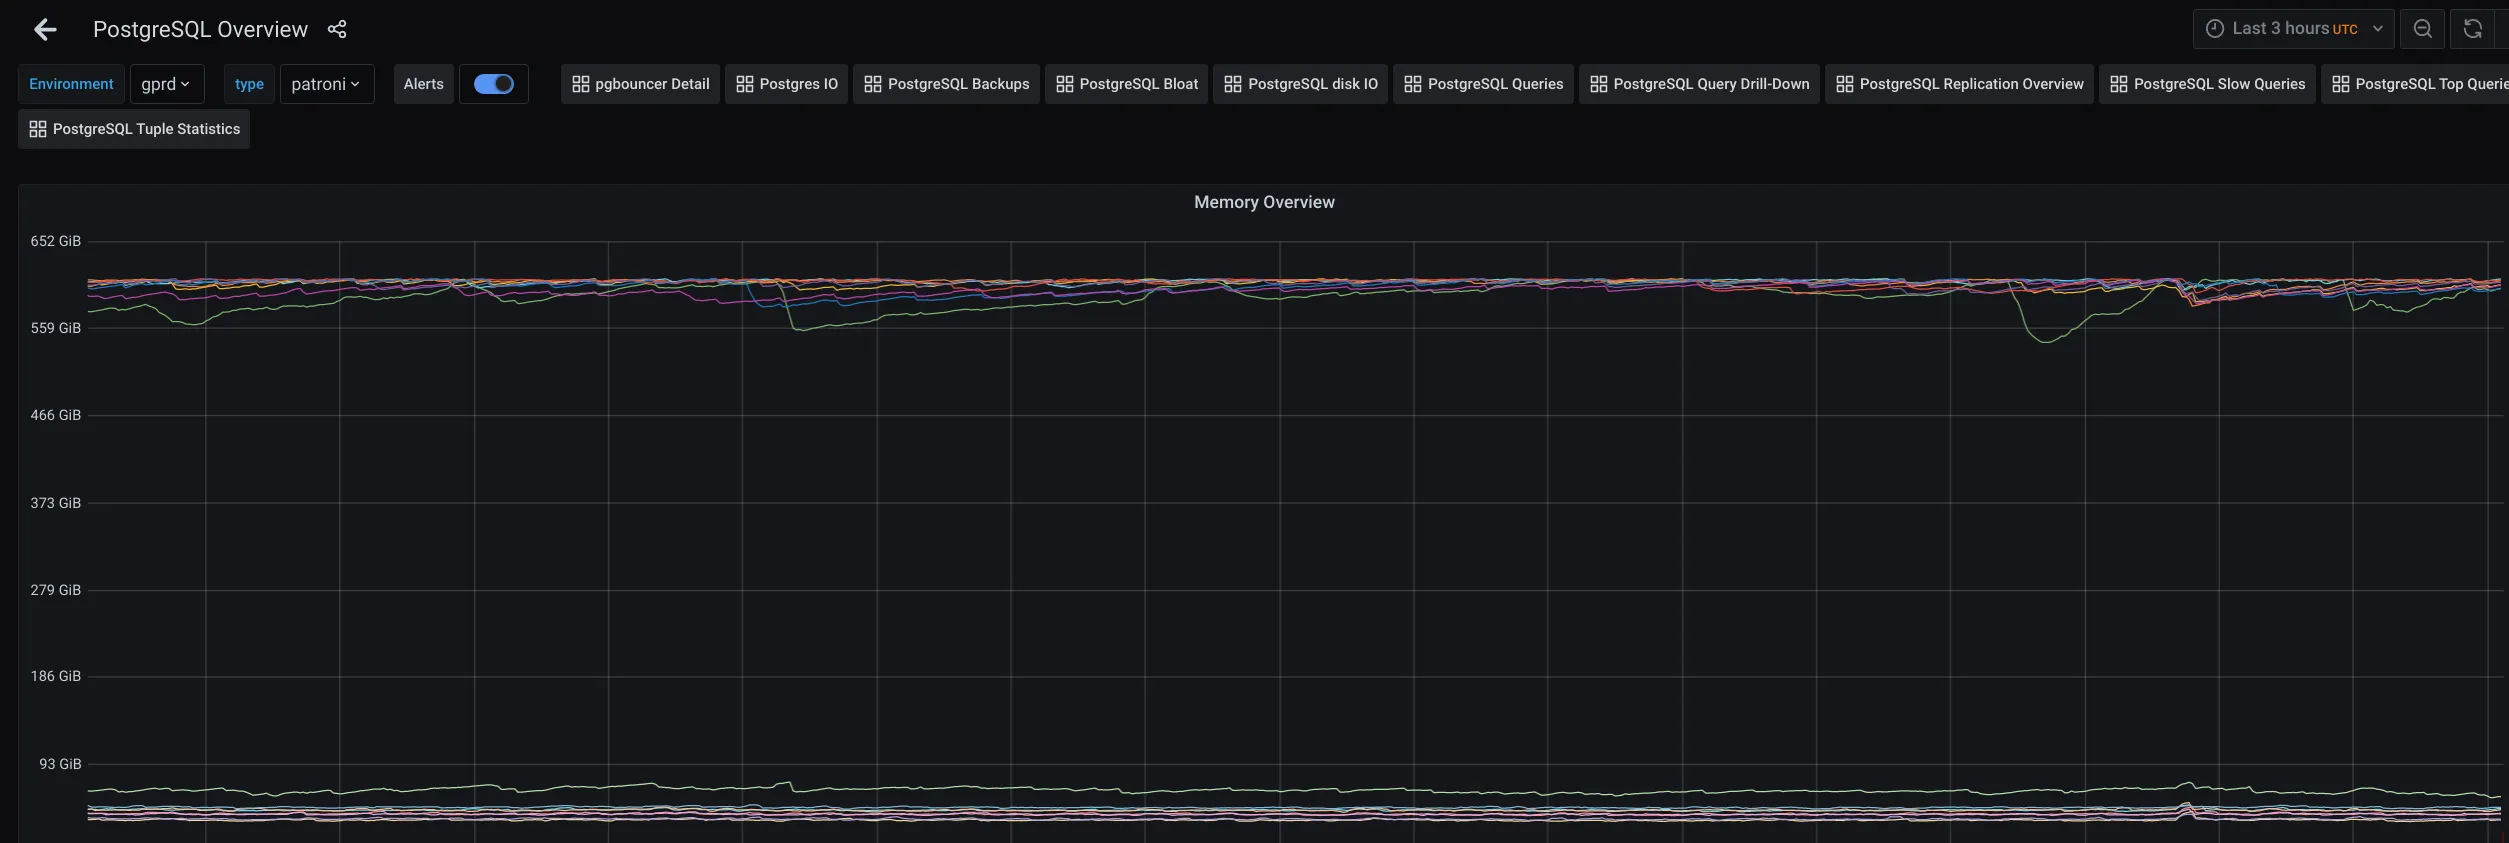
Section titled “Check for memory utilization”Check this graph for an overview of memory utilization:
Check for Context Switches anomalies
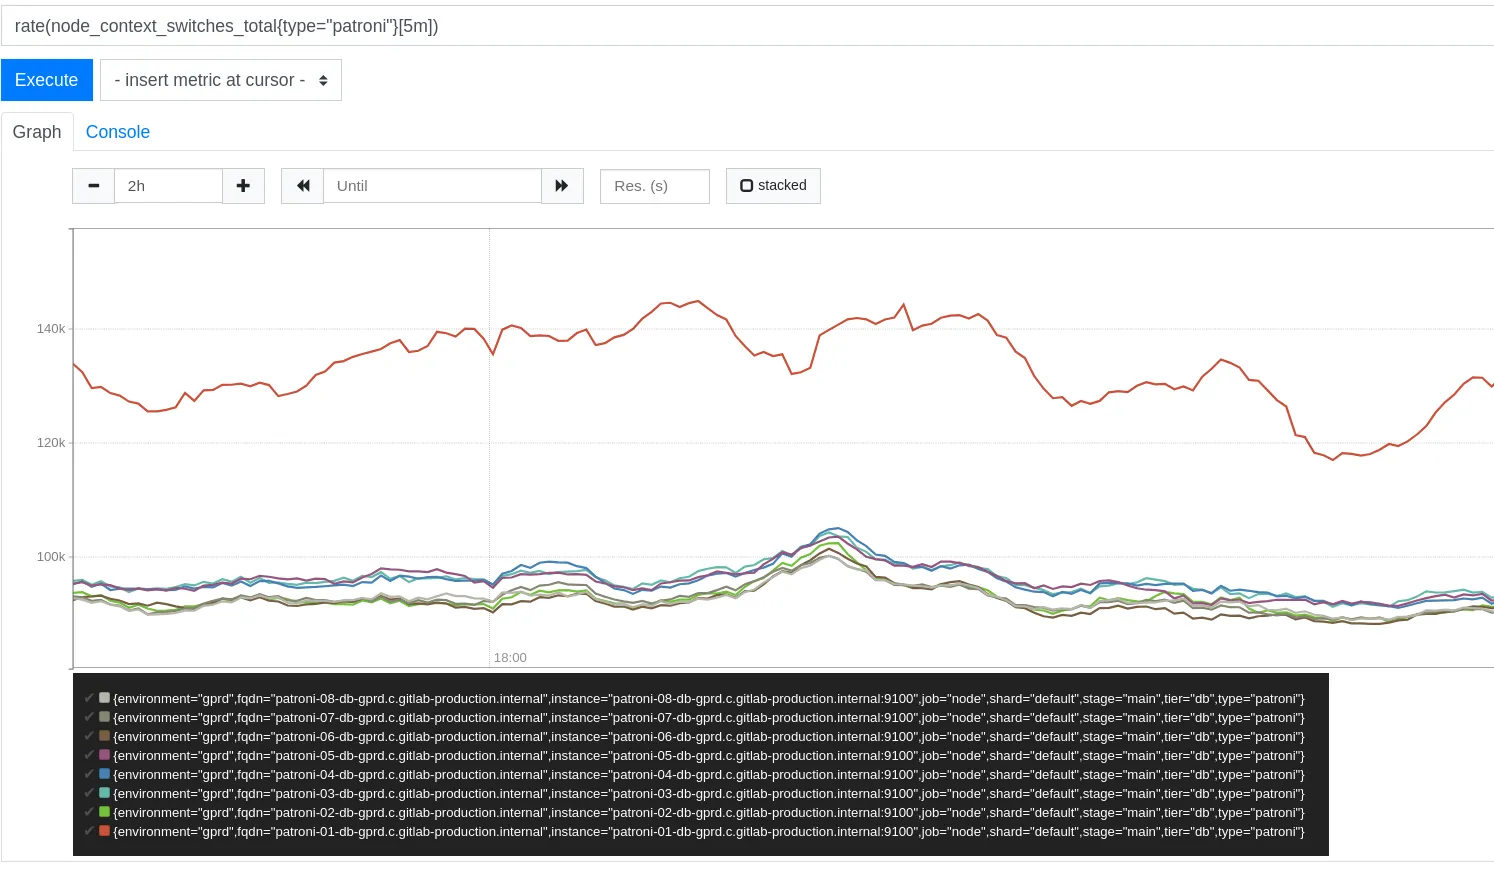
Section titled “Check for Context Switches anomalies”A context switch is the process of storing the state of a process or thread, so that it can be restored and resume execution at a later point. It can be seen as a measure of total througput of the system. Check the CS metric for spikes or low peaks.
Check for Buffer cache utilization
Section titled “Check for Buffer cache utilization”Specially after a failover, a DB repair (indexing, repacking), the cache access pattern can change. With a “cold” cache, query performance may suffer. Check this graph to verify the cache hit/read percentaje. Under normal conditions, it should be close to 99%.

Check for IO saturation
Section titled “Check for IO saturation”Disk saturation can cause severe service degradation. Check the PostgreSQL Overview dashboard, specially at the following graphs:
- disk IO wait
sdb - Disk IO utilization
sdb - Retransmit rate (outbound only), resending possibly lost packets
The sdb device is the most important to monitor, because it contains the $PGDATA space.
If you need to go deeper, you can log in into the desired instance and use the iotop to find out wich process is using most IO:
sudo iotop -P -a
Total DISK READ : 0.00 B/s | Total DISK WRITE : 0.00 B/sActual DISK READ: 0.00 B/s | Actual DISK WRITE: 0.00 B/s PID PRIO USER DISK READ DISK WRITE SWAPIN IO> COMMAND 1 be/4 root 0.00 B 0.00 B 0.00 % 0.00 % systemd --system --deserialize 28 2 be/4 root 0.00 B 0.00 B 0.00 % 0.00 % [kthreadd] 4 be/0 root 0.00 B 0.00 B 0.00 % 0.00 % [kworker/0:0H]24581 be/4 nelsnels 0.00 B 0.00 B 0.00 % 0.00 % [bash] 6 be/0 root 0.00 B 0.00 B 0.00 % 0.00 % [mm_percpu_wq] 7 be/4 root 0.00 B 0.00 B 0.00 % 0.00 % [ksoftirqd/0] 8 be/4 root 0.00 B 0.00 B 0.00 % 0.00 % [rcu_sched] 9 be/4 root 0.00 B 0.00 B 0.00 % 0.00 % [rcu_bh] 10 rt/4 root 0.00 B 0.00 B 0.00 % 0.00 % [migration/0] 11 rt/4 root 0.00 B 0.00 B 0.00 % 0.00 % [watchdog/0] 12 be/4 root 0.00 B 0.00 B 0.00 % 0.00 % [cpuhp/0] 13 be/4 root 0.00 B 0.00 B 0.00 % 0.00 % [cpuhp/1] 14 rt/4 root 0.00 B 0.00 B 0.00 % 0.00 % [watchdog/1] 15 rt/4 root 0.00 B 0.00 B 0.00 % 0.00 % [migration/1] 16 be/4 root 0.00 B 0.00 B 0.00 % 0.00 % [ksoftirqd/1] 18 be/0 root 0.00 B 0.00 B 0.00 % 0.00 % [kworker/1:0H] 19 be/4 root 0.00 B 0.00 B 0.00 % 0.00 % [cpuhp/2] 20 rt/4 root 0.00 B 0.00 B 0.00 % 0.00 % [watchdog/2]And if you found an specific pid that is using many IO%, you can execute sudo gitlab-psql and check what is that pid executing with:
SELECT * from pg_stat_activity where pid=<pid from iotop>Disk saturation may also be investigated using iotop tool:
Linux 4.15.0-1047-gcp (patroni-01-db-gprd)  07/07/2020  _x86_64_ (96 CPU)
avg-cpu:  %user   %nice %system %iowait  %steal   %idle           5.09    0.03    1.83    0.55    0.00   92.51
Device:         rrqm/s   wrqm/s     r/s     w/s    rkB/s    wkB/s avgrq-sz avgqu-sz   await r_await w_await  svctm  %utilloop0             0.00     0.00    0.00    0.00     0.00     0.00     3.20     0.00    0.00    0.00    0.00   0.00   0.00sdc               0.00     1.65    0.06    0.97     6.09    36.53    82.58     0.00    6.96    5.96    7.03   1.16   0.12sda               0.00     2.41    1.73    9.70    34.06  1858.20   330.96     0.12   13.27    7.14   14.37   1.38   1.57sdb               0.00    82.17  566.59 2433.62 23929.43 50266.94    49.46     0.18    0.03    0.34    0.04   0.07  19.55
avg-cpu:  %user   %nice %system %iowait  %steal   %idle           8.38    0.00    2.48    0.50    0.00   88.63
Device:         rrqm/s   wrqm/s     r/s     w/s    rkB/s    wkB/s avgrq-sz avgqu-sz   await r_await w_await  svctm  %utilloop0             0.00     0.00    0.00    0.00     0.00     0.00     0.00     0.00    0.00    0.00    0.00   0.00   0.00sdc               0.00    12.00    0.00    7.00     0.00   112.00    32.00     0.00    0.00    0.00    0.00   0.00   0.00sda               0.00     0.00    0.00   38.00     0.00  9112.00   479.58     0.15    5.37    0.00    5.37   0.74   2.80sdb               0.00     0.00  490.00 1582.00  4220.00 18576.00    22.00     0.72    0.57    0.66    0.55   0.09  19.60
avg-cpu:  %user   %nice %system %iowait  %steal   %idle          10.79    0.00    2.52    0.70    0.00   85.99
Device:         rrqm/s   wrqm/s     r/s     w/s    rkB/s    wkB/s avgrq-sz avgqu-sz   await r_await w_await  svctm  %utilloop0             0.00     0.00    0.00    0.00     0.00     0.00     0.00     0.00    0.00    0.00    0.00   0.00   0.00sdc               0.00     0.00    0.00    0.00     0.00     0.00     0.00     0.00    0.00    0.00    0.00   0.00   0.00sda               0.00     0.00    0.00    0.00     0.00     0.00     0.00     0.00    0.00    0.00    0.00   0.00   0.00sdb               0.00   133.00  903.00 1647.00  8180.00 22492.00    24.06     1.21    0.68    0.54    0.76   0.11  27.20
Check for network anomalies
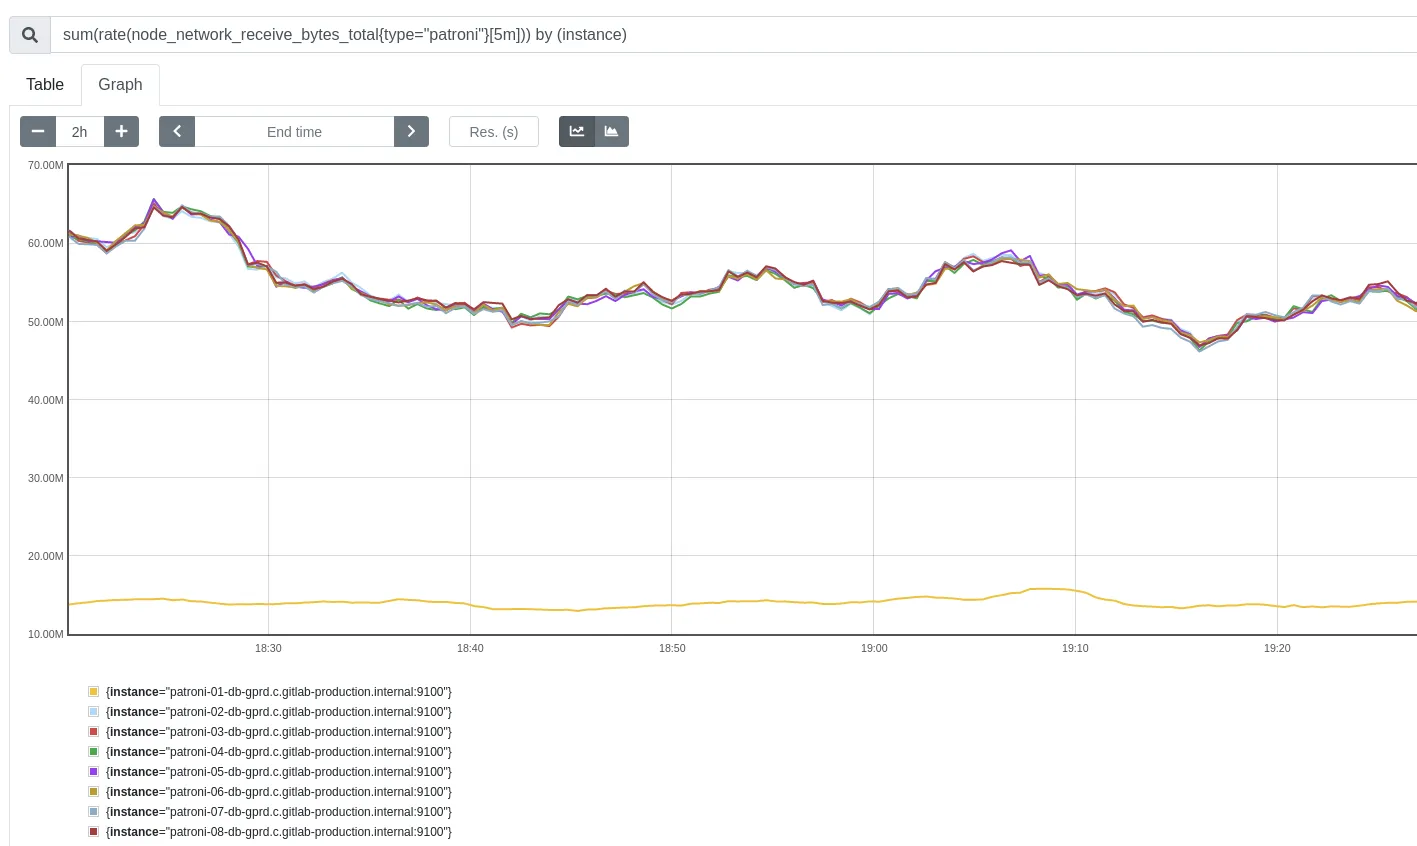
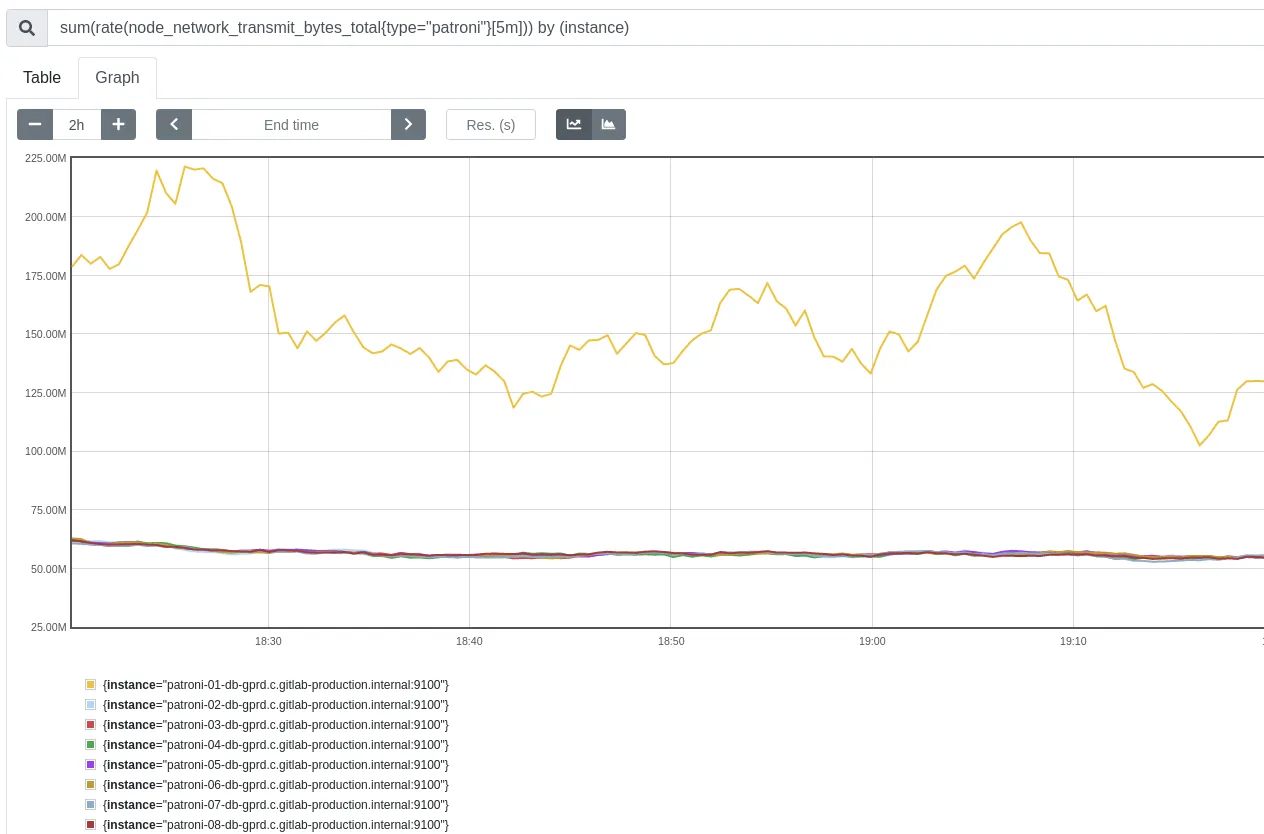
Section titled “Check for network anomalies”Correct network traffic is critical in any cloud enviroment. Check the Network utilization graph to check the network of patroni hosts. This panel includes (for patroni hosts):
- Incoming traffic
- Outbound traffic
- Retransmition rate (high rate of retransmitions could be paired with higher IO utilization)
![]()
Check for differences in the graphs (same metric, different host)
Section titled “Check for differences in the graphs (same metric, different host)”Load among RO patroni hosts is evenly distributed, so in average, you might expect every metric be similar for every patroni node in the RO ring. When that is not the case, it ussually means that there is some unknown problem with that particular instance, like:
- one patroni instance with much higher replication lag than the rest
- much higher IO usage / io wait than the rest
In general, when those differences are not easy to explain, its because on some issue with GCP, and in most cases that instance/disk must be replaced.
Check for slow queries
Section titled “Check for slow queries”This board contains information about how many queries took more than 5 seconds.
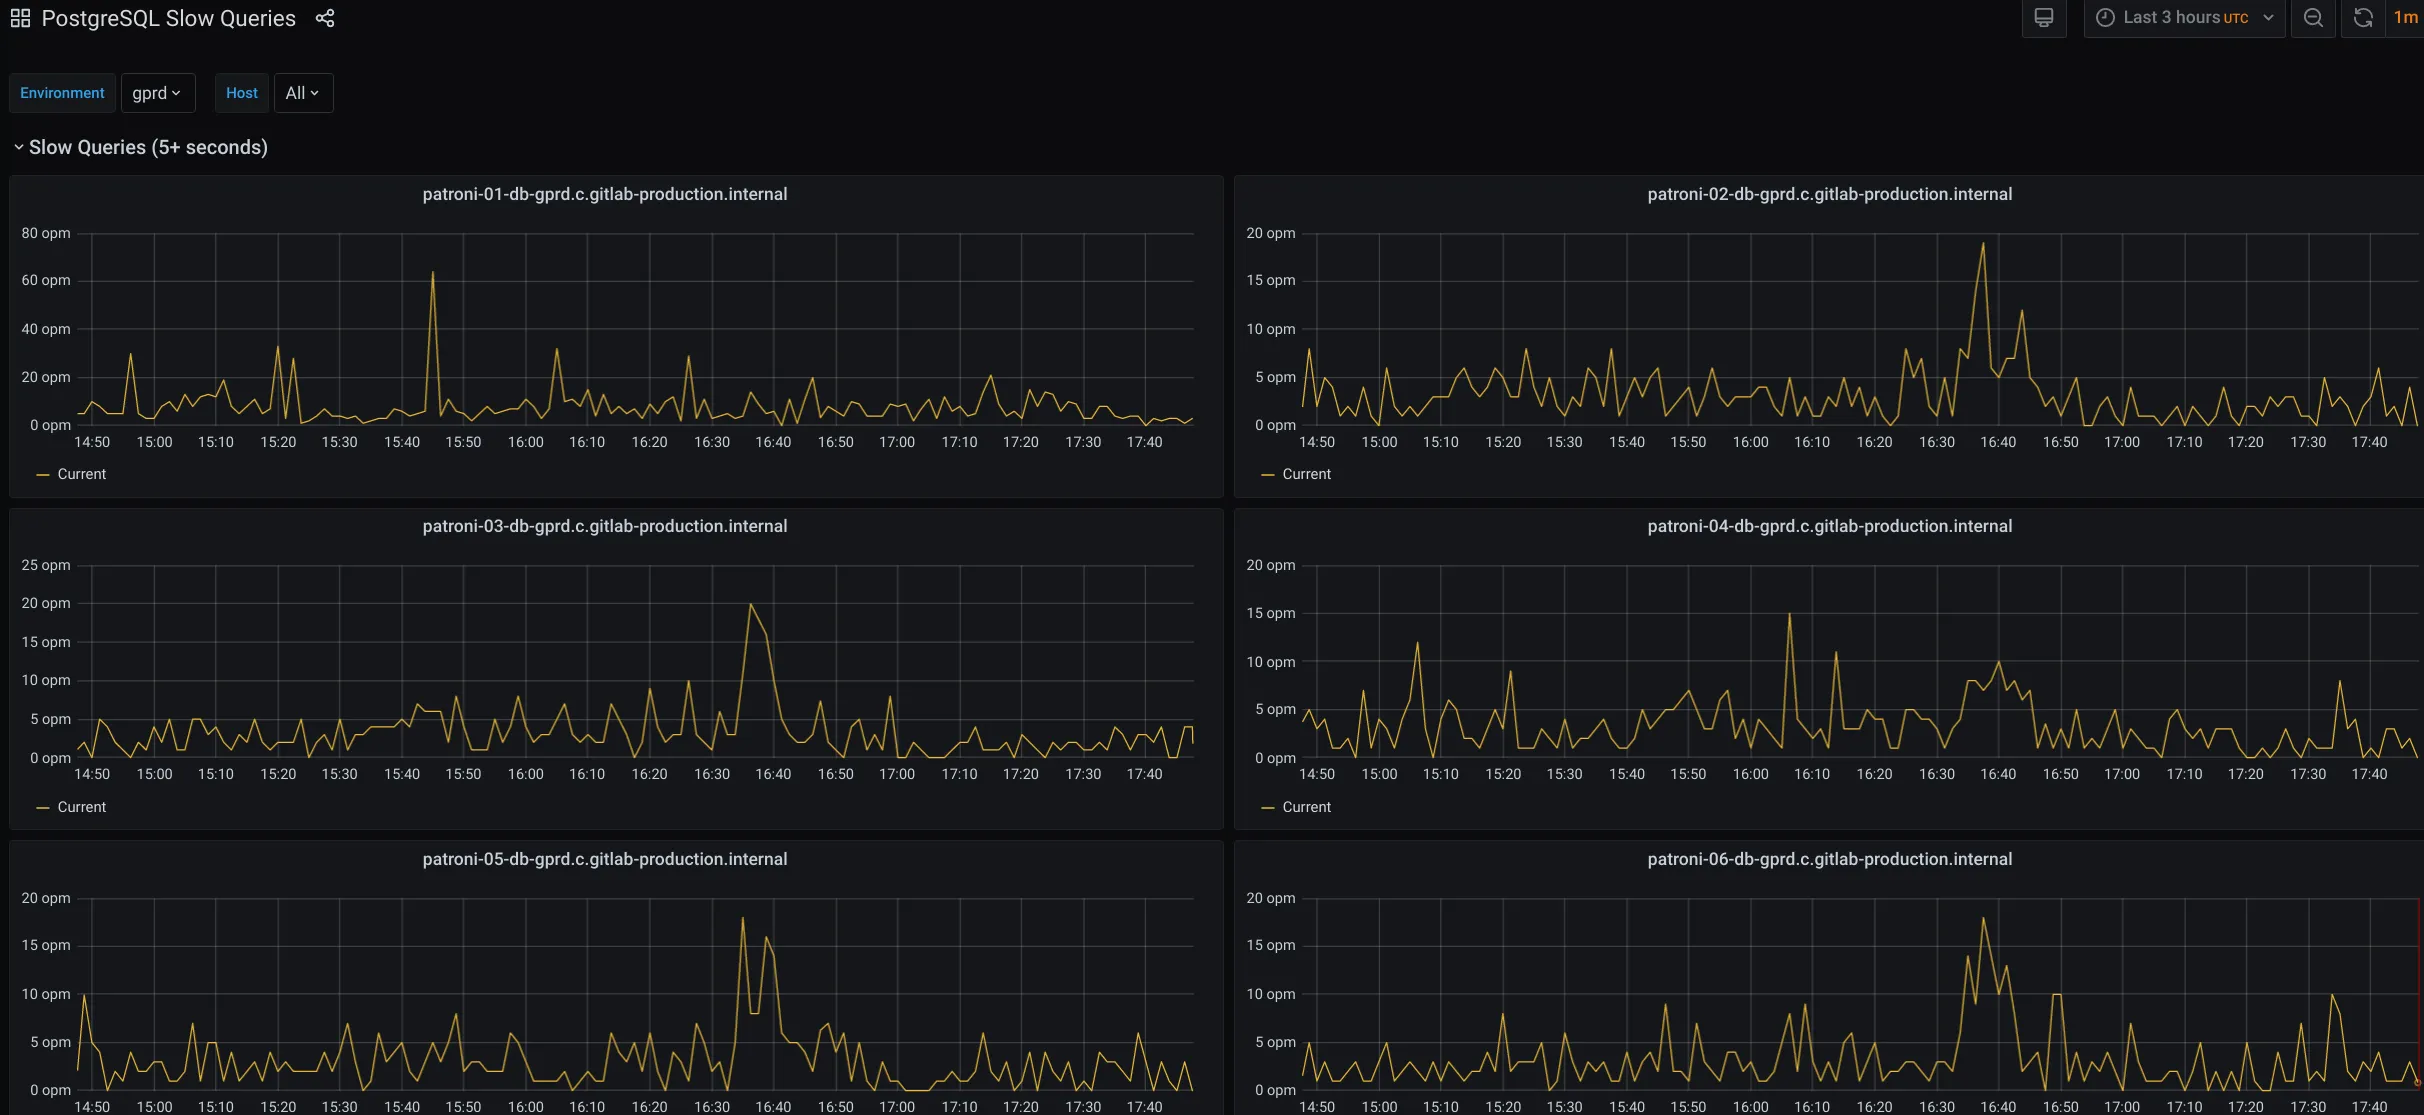
Check the PostgreSQL queries board to check for an increasing rate of slow queries (Slow queries graph). You can also check for blocked queries (Blocked Queries graph).
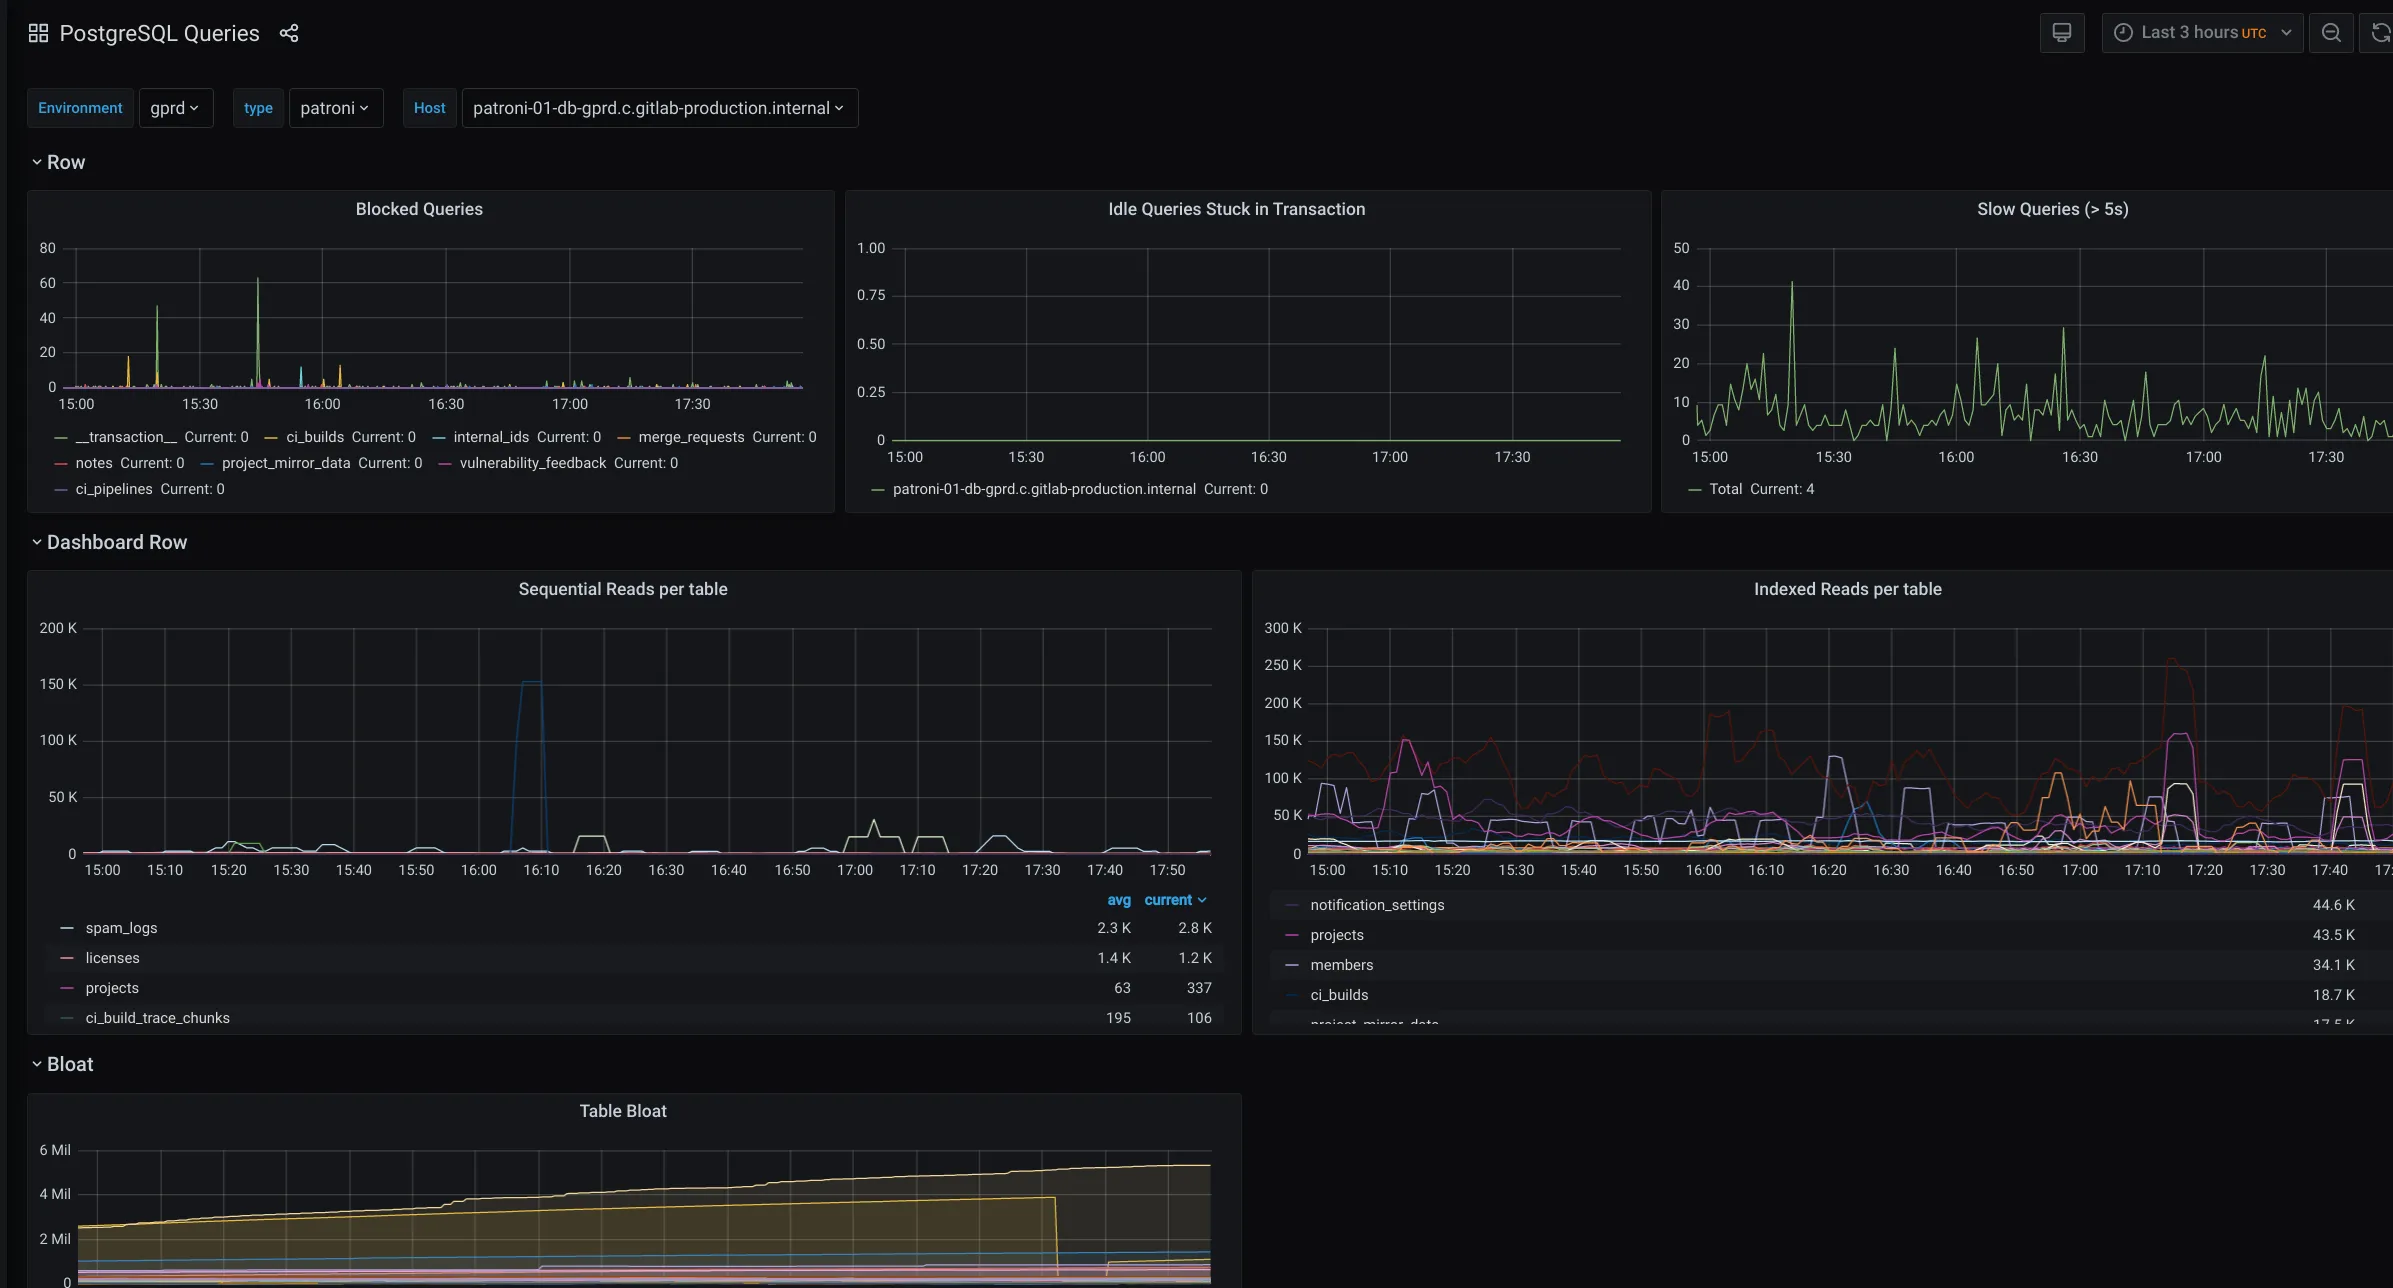
For troubleshooting blocked queries, see this runbook
Checkpoint activity
Section titled “Checkpoint activity”Checkpoint is the act of pushing all the write buffers to disk. A sudden increase of write activity (like indexing, repacking, etc) may also increase the rate of checkpoints, and can cause the system to slow down. You can see this graph to see how often checkpoints are taking place. Focus on the current leader. If checkpoints do ocurr too often (more than checkpoint_warning) you will see a message in the logs, similar to
LOG: checkpoints are occurring too frequently (8 seconds apart)
Althoug this is more like a warning message, it can be OK under heavy write activity.
Check the load from queries
Section titled “Check the load from queries”Too much concurrent activity can affect performance. Refer to this runbook to evaluate server activity.
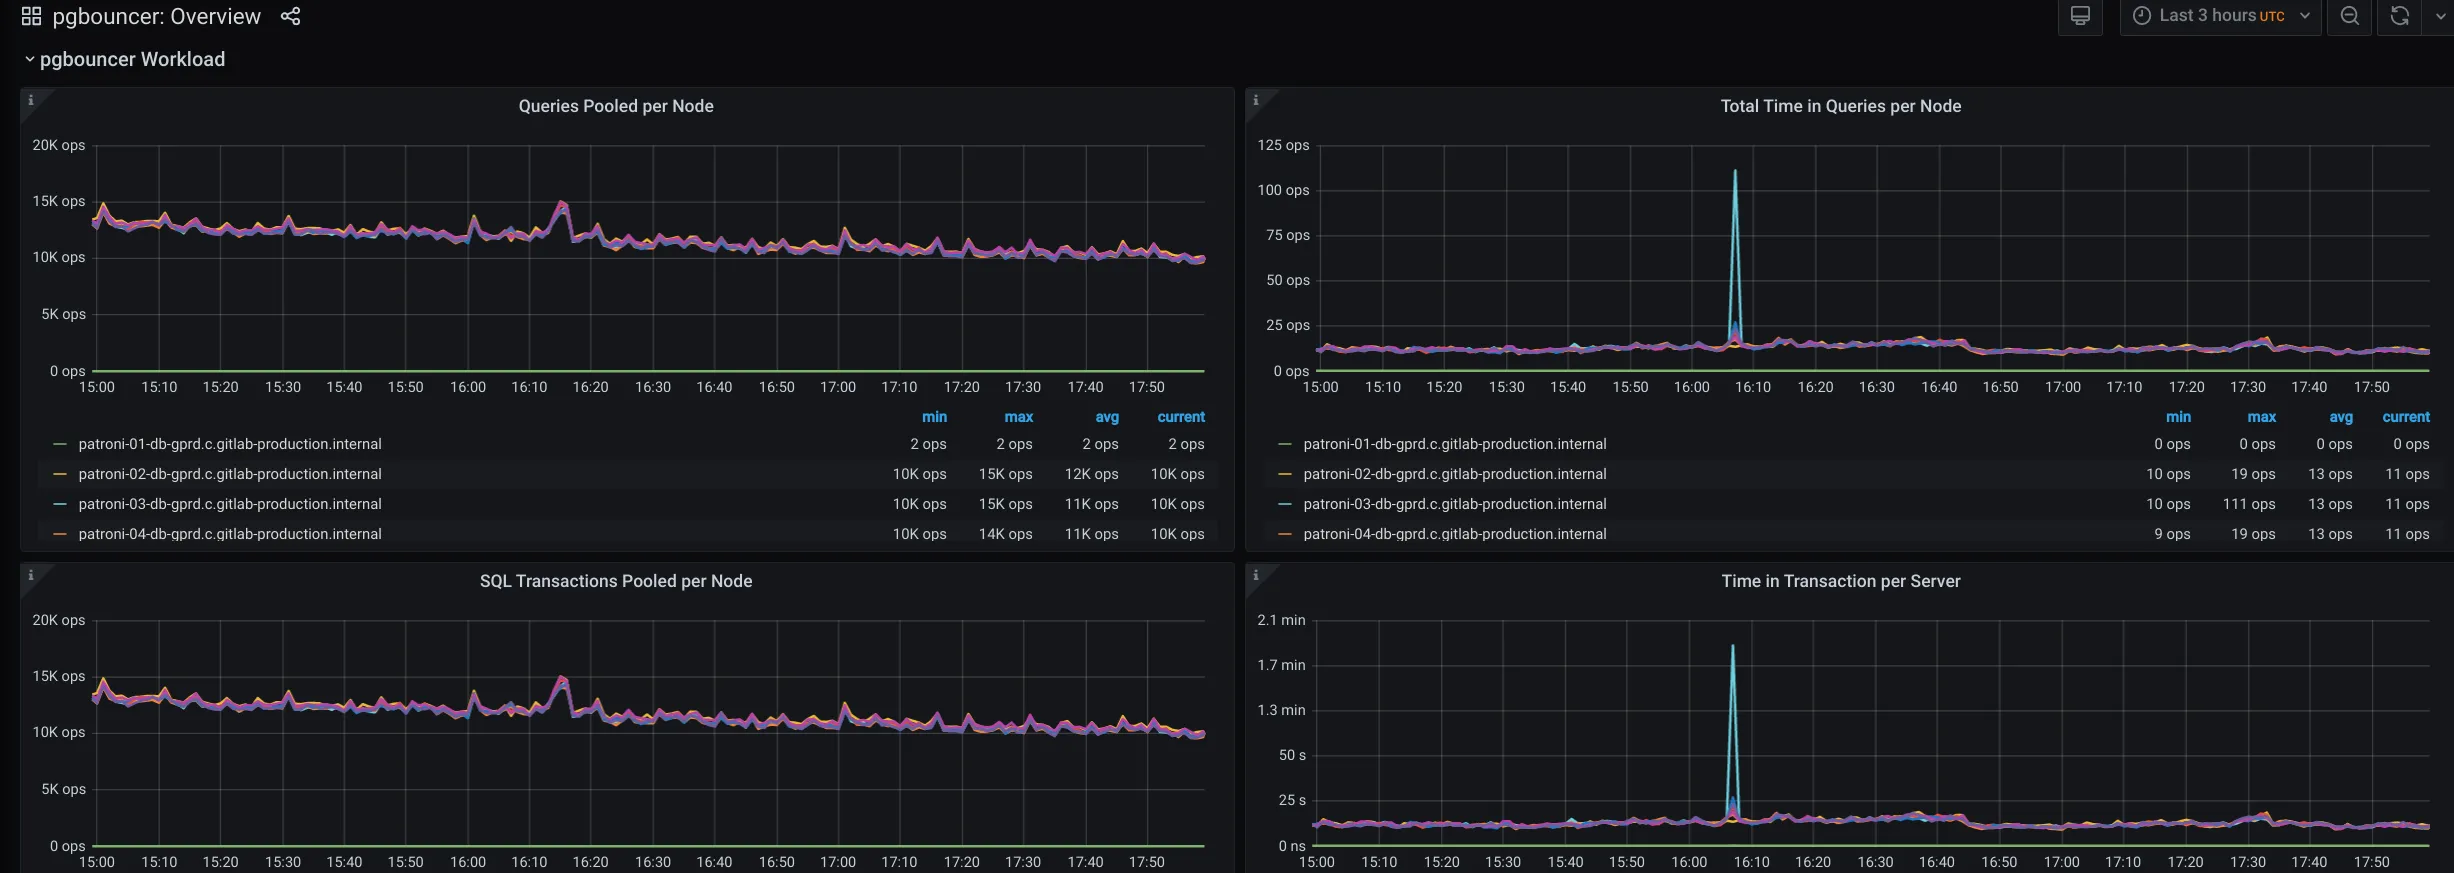
Checks for pgBouncer
Section titled “Checks for pgBouncer”Waiting clients
Section titled “Waiting clients”The PgBouncer Overview shows pgBouncer related information.
When troubleshooting, check that:
-
if
Waiting Client Connections per Poolis consistenly high, it may be related to slow queries taking most available connections in the pool, so others have to wait. Refer to this runbook to evaluate server activity. -
if
Connection Saturation per Poolis consistenly close to 100%, probably the database is not able to keep up the requests. Refer to this runbook to evaluate server activity. -
PgBouncer is single threaded. That means that a single core will do most of the job. If
pgbouncer Single Threaded CPU Saturation per Nodeis consistently close to 100%, performance of pgBouncer will decrease. You can use theSHOW CLIENTScommand to check where the clients are connecting from for a start:
:~$ sudo pgb-consolepsql (11.7 (Ubuntu 11.7-2.pgdg16.04+1), server 1.12.0/bouncer)Type "help" for help.
pgbouncer=# show clients;
 type |   user    |      database       | state  |     addr     | port  | local_addr | local_port |      connect_time       |      request_time       |  wait  | wait_us | close_needed |      ptr       |   link   | remote_pid | tls------+-----------+---------------------+--------+--------------+-------+------------+------------+-------------------------+-------------------------+--------+---------+--------------+----------------+----------+------------+----- C    | gitlab    | gitlabhq_production | active | 10.218.5.2   | 35140 | 10.217.4.5 |       6432 | 2020-07-03 10:59:50 UTC | 2020-07-03 12:46:38 UTC |      0 |       0 |            0 | 0x7fefc1d29880 |          |          0 | C    | gitlab    | gitlabhq_production | active | 10.220.4.33  | 43228 | 10.217.4.5 |       6432 | 2020-07-07 18:25:01 UTC | 2020-07-07 19:32:06 UTC |      0 |       0 |            0 | 0x7fefc1d48270 |          |          0 | C    | gitlab    | gitlabhq_production | active | 10.220.8.9   | 48214 | 10.217.4.5 |       6432 | 2020-07-07 18:25:59 UTC | 2020-07-07 19:31:28 UTC |      0 |       0 |            0 | 0xee0ed8       |          |          0 | C    | gitlab    | gitlabhq_production | active | 10.220.8.12  | 56232 | 10.217.4.5 |       6432 | 2020-07-07 18:26:00 UTC | 2020-07-07 19:32:24 UTC |      0 |       0 |            0 | 0x7fefc1d48ad0 |          |          0 | C    | gitlab    | gitlabhq_production | active | 10.220.9.209 | 36196 | 10.217.4.5 |       6432 | 2020-07-07 18:26:47 UTC | 2020-07-07 19:32:36 UTC |      0 |       0 |            0 | 0x7fefc1ce6df8 |          |          0 | C    | gitlab    | gitlabhq_production | active | 10.220.4.33  | 33986 | 10.217.4.5 |       6432 | 2020-07-07 18:26:51 UTC | 2020-07-07 19:32:38 UTC |      0 |       0 |            0 | 0x7fefc1d43928 |          |          0 | C    | gitlab    | gitlabhq_production | active | 10.220.8.6   | 46466 | 10.217.4.5 |       6432 | 2020-07-07 18:27:34 UTC | 2020-07-07 19:31:48 UTC |      0 |       0 |            0 | 0x7fefc1d47e40 |          |          0 | C    | gitlab    | gitlabhq_production | active | 10.218.5.2   | 57862 | 10.217.4.5 |       6432 | 2020-07-07 18:27:44 UTC | 2020-07-07 18:27:44 UTC |      0 |       0 |