Mapping Postgres Statements, Slowlogs, Activity Monitoring and Traces
Understanding the workloads that the application is sending to the database is critical to diagnosing performance issues.
GitLab’s Postgres cluster has several tools for understanding these workloads, including:
pg_stat_statements- this Postgres module provides a means for tracking execution statistics of all SQL statements executed by a server. Statements are grouped byqueryid, an internal hash code, computed from the statement’s parse tree. This means that statements that only differ by values will have matchingqueryids.pg_stat_activityis a subsystem that supports collection and reporting of information about server activity.pg_stat_activityinformation incudes the SQL query running, but noqueryid, so can be tricky to map back topg_stat_statements.postgres_exporterthis exporter polls Postgres and returns data frompg_stat_statements(and many other subsystems) into Prometheus.pg_stat_statementsis exported as the metricspg_stat_statements_calls(counts the number of times a statement is being called),pg_stat_statements_rows(counts the total number of rows being returned for the statement) and thepg_stat_statements_seconds_total(total time spent executing each different statement) metrics, amongst others. Note that all of thepg_stat_statementsmetrics are keyed byqueryid.- Marginalia GitLab Rails processes use a Ruby Gem to add query comments containing application related context information to PostgreSQL queries generated by ActiveRecord.
- Marginalia Sampler this is a simple hack for the Postgres exporter to sample the
pg_stat_activitytables on our postgres instances, parse out contextual Marginalia information, and export this information in aggregate. During a incident, this information may prove valuable in understand the type of workloads that were running on Postgres at the time. - Postgres Slowlogs when a statement runs for more than 1s, Postgres will write a slow log entry. This slowlog entry will contain the SQL of the call, including the Marginalia comments, which we can use to obtain detailed context. GitLab.com’s log sender uses a custom log parser for Postgres which will redact any private information from the SQL statement, and also generate a “fingerprint” of the SQL statement. Similar to (but not the same as) the
queryidthat is presented in thepg_stat_statements. This fingerprint can be used to group multiple statements together as the same workload. It’s important to remember that the slowlogs are small subset of all queries, limited to the worst performers. High-volume fast queries may have a major impact on the performance of a Postgres server, but may not necessarily show up in the slowlog. - Distributed Traces GitLab supports Distributed Tracing, although this is only partially supported in Production on GitLab.com. GitLab SQL traces include
fingerprintinformation for the query issued from Rails. pg_stat_statementsfluentd polling logs Our fluentd plugin will periodically dump the all queries frompg_stat_statements, normalize these values to remove private information, generate a normalizedfingerprintvalue and dump these to our logs. Crucially, these logs contain bothqueryidandfingerprint, allowing us to map between these identifiers.pg_stat_activityfluentd polling logs Our fluentd plugin will periodically dump the all queries frompg_stat_activity, normalize these values to remove private information, generate a normalizedfingerprintvalue and dump these to our logs.
Summary
Section titled “Summary”| Signal | correlation_id | endpoint_id | queryid | fingerprint | Normalized SQL | Type |
|---|---|---|---|---|---|---|
pg_stat_statements metrics | :white_check_mark: | Complete stats for top 5000 queries per instance | ||||
pg_stat_activity marginalia sampler | :white_check_mark: | Sampled (every 15s) | ||||
| slowlog | :white_check_mark: | :white_check_mark: | Sampled (query >1 s) | |||
pg_stat_statements fluentd polling logs | :white_check_mark: | :white_check_mark: | :white_check_mark: | Sampled (every 30m) | ||
pg_stat_activity fluentd polling logs | :white_check_mark: | :white_check_mark: | :white_check_mark: | :white_check_mark: | Sampled (every 1m) | |
| distributed traces | :white_check_mark: | :white_check_mark: | :white_check_mark: | :white_check_mark: | Sampled |
Mapping Between Different Postgres Signals
Section titled “Mapping Between Different Postgres Signals”The key, (the “rosetta stone”!) to map between the different data sources, is the pg_stat_statements fluentd polling logs. This is because it contains fingerprint, queryid and the query SQL.
So, to correlate between any two signals, its often easiest to map via the pg_stat_statements fluentd polling logs, obtain the second identifier, and then use that elsewhere.
Some worked examples might help
Example Queries
Section titled “Example Queries”Find the queryid or fingerprint for a certain SQL statement
Section titled “Find the queryid or fingerprint for a certain SQL statement”graph LR
subgraph pg_stat_statements logs
F[fingerprint] --> Q[queryid]
Q --> F
S[sql query] --> F
F --> S
end
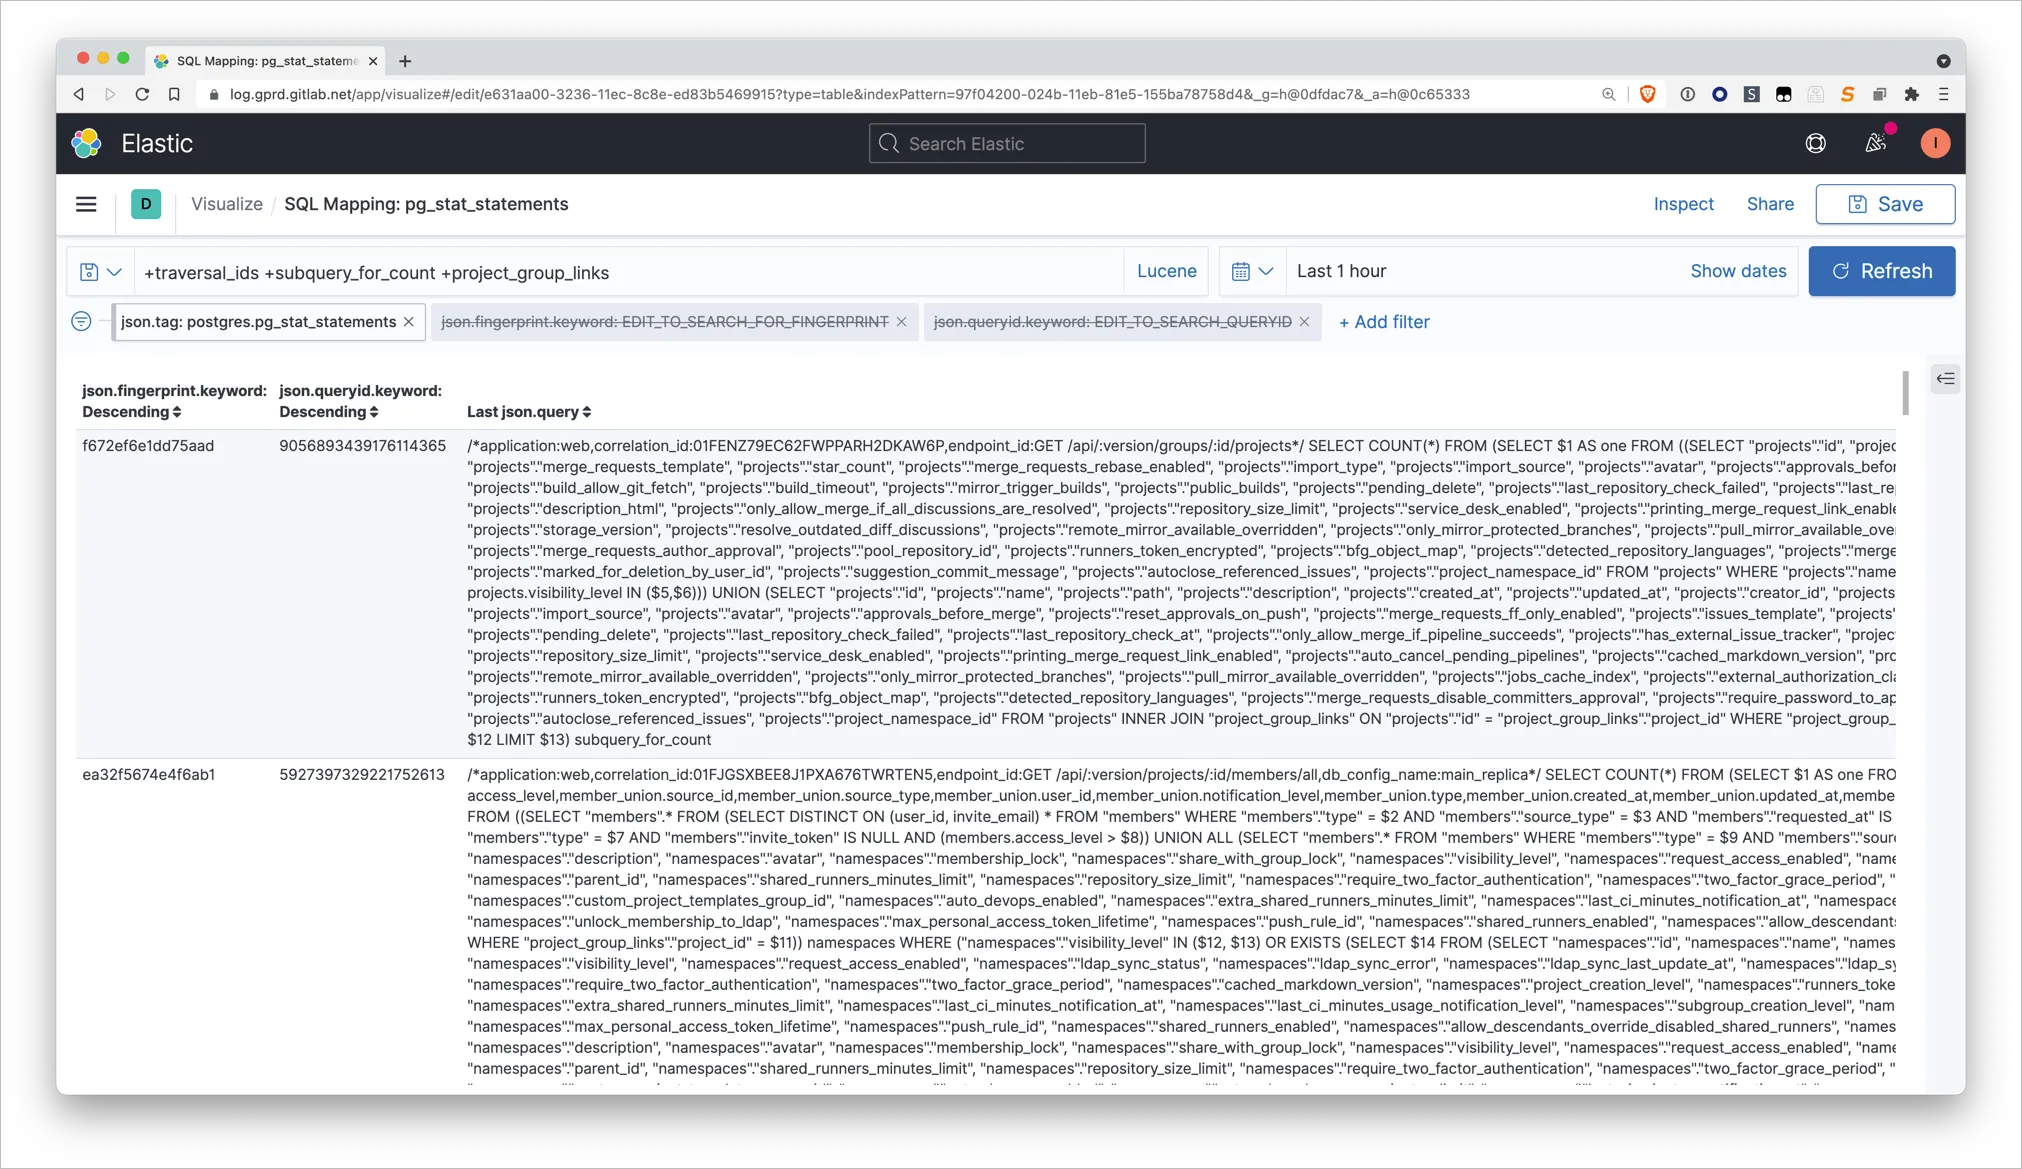
- In the
pg_stat_statementsfluentd polling logs, search thejson.queryfield for SQL, then select thejson.queryid/json.fingerprint. - Sample query: https://log.gprd.gitlab.net/goto/bb0d5fe2522b4bc1ceb030adeb2b789e
- Note: during the parsing process, keep in mind that ElasticSearch breaks your query up into individual words in the parsing process. Instead of searching for
SELECT * FROM table_x WHERE name=?, break you query up into components, such as+SELECT +table_x +namewhich will match queries that contain all three of these terms. - Note: the marginalia comments in
pg_stat_statementsqueries represent the first time a statement was detected by postgres, so don’t rely on them for context. We can use other techniques for that purpose.
Find endpoints that are calling a specific statement
Section titled “Find endpoints that are calling a specific statement”graph LR
subgraph pg_stat_statements logs
Q[queryid] --> F[fingerprint]
end
subgraph pg_stat_activity logs
F --> D[fingerprint]
end
-
Sometimes an expensive query will be isolated through the
pg_stat_statementsmetrics. These queries are identified byqueryid. -
First, resolve the
queryidto thefingerprintof the statement and thestatementitself (see above for details): https://log.gprd.gitlab.net/goto/bc93e56f00a4d61772ae47cc581fdbf4 -
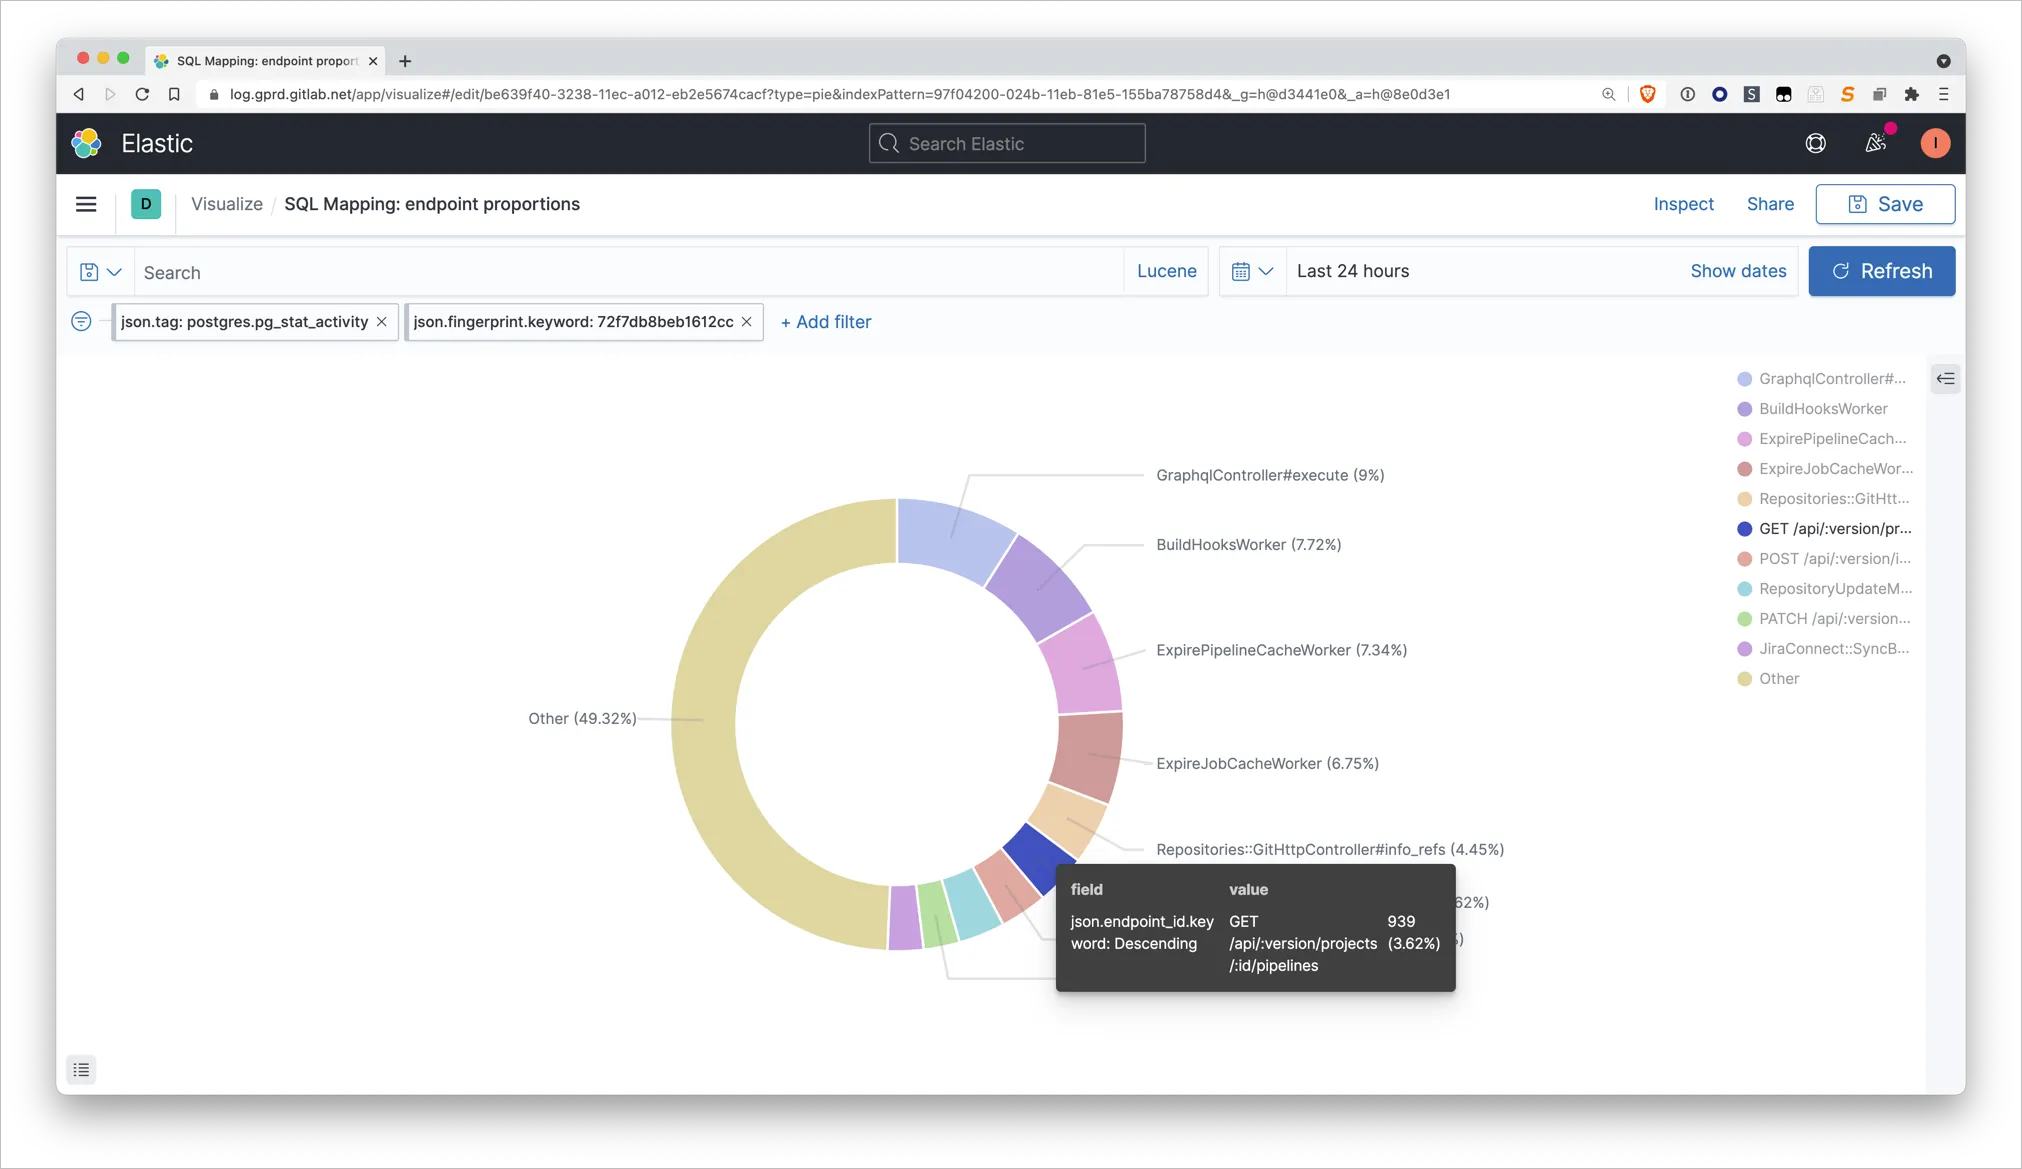
In the
pg_stat_activityfluentd polling logs, search by thefingerprint, then visualize the results, aggregating by count, splitting the visualization by termendpoint_id. -
Sample query: https://log.gprd.gitlab.net/goto/08dbb0fecc28b3b1e3fd3b002ce1b611
-
Caveat: keep in mind that this technique uses data with a very low sample rate:
pg_stat_activityfluentd polling only takes place once a minute - a lot can happen between polls. Review the sample sizes in the chart mouse-overs to get an idea of confidence levels.
Analyzing what was running on a Postgres Instance at a specific time
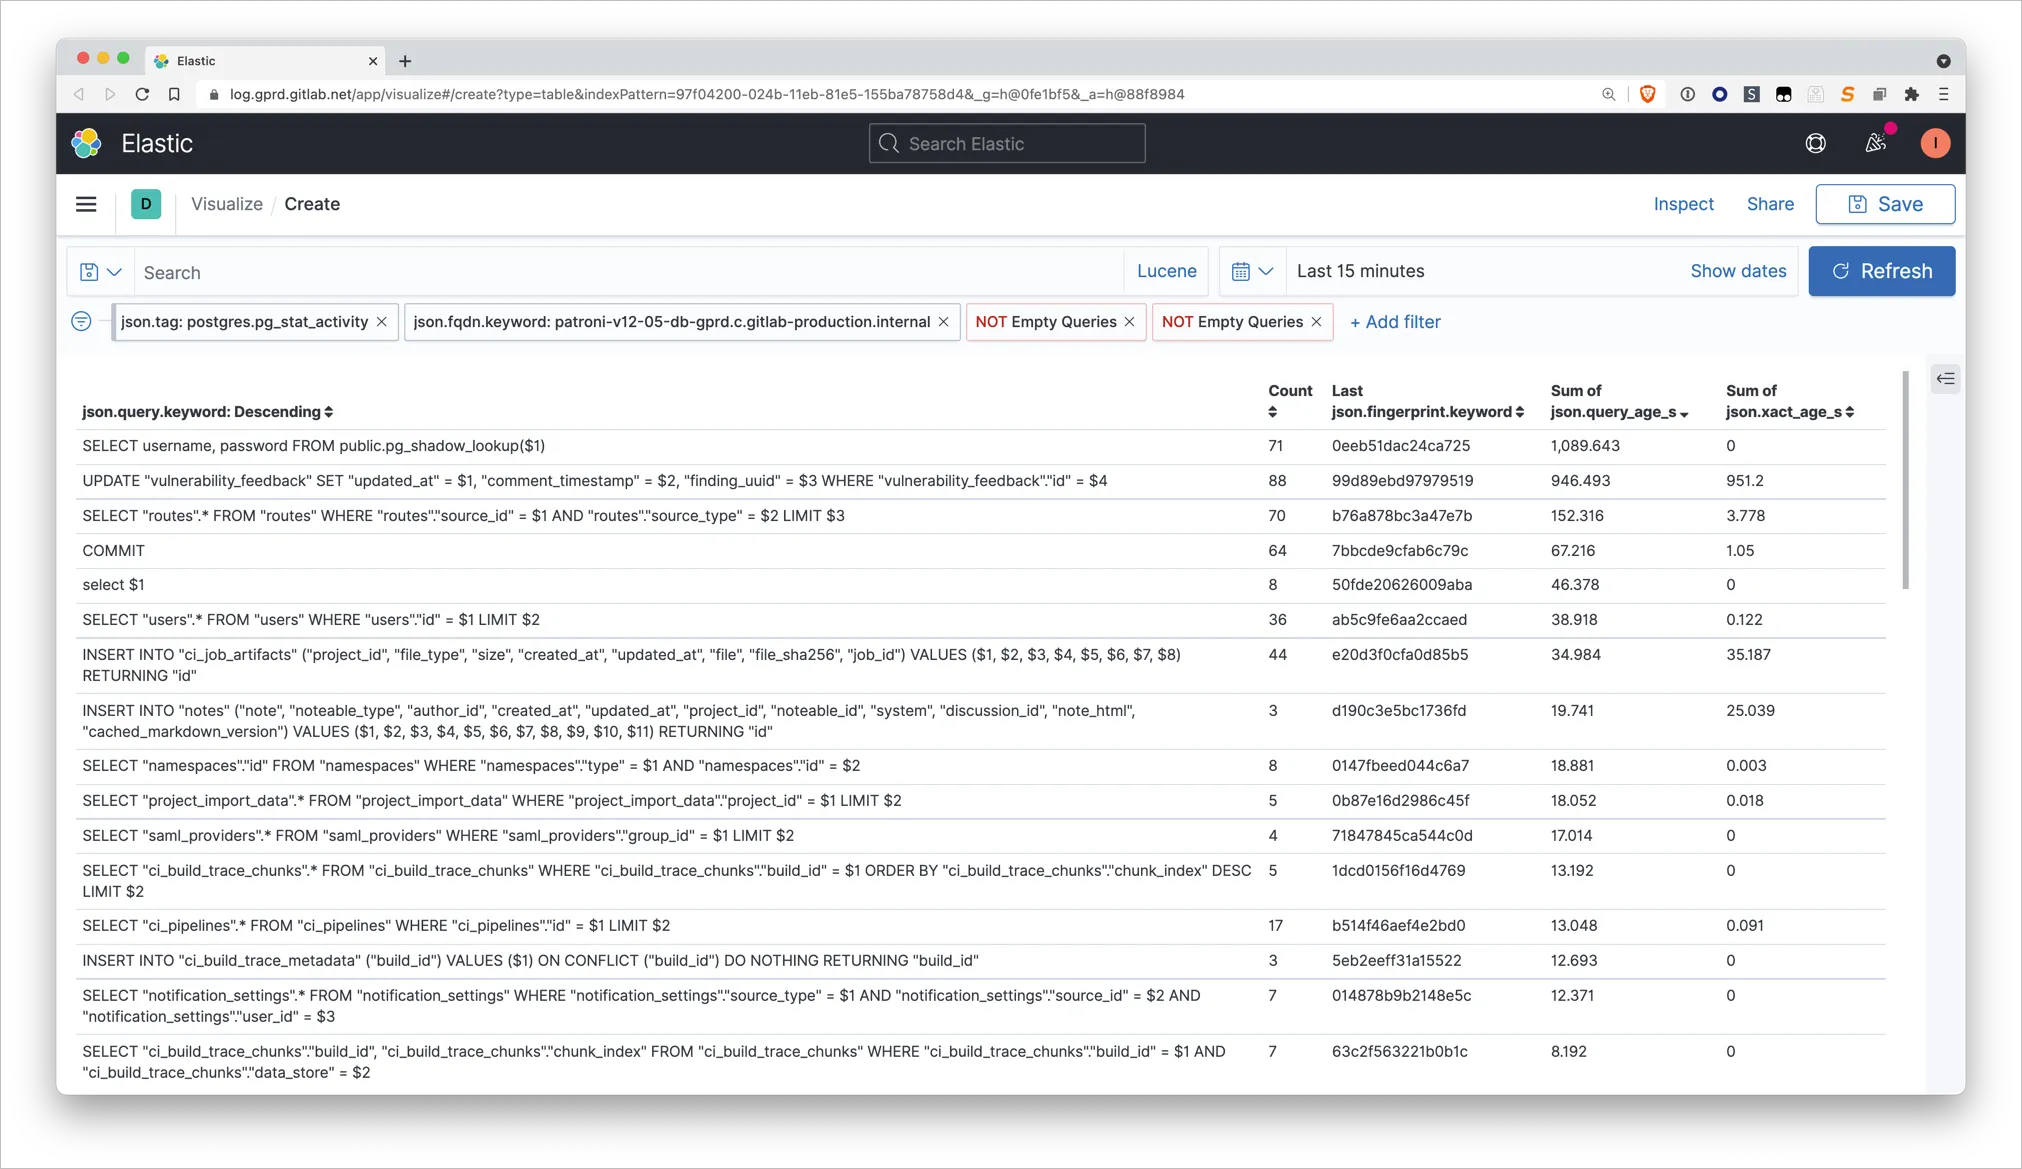
Section titled “Analyzing what was running on a Postgres Instance at a specific time”- Filter the
pg_stat_activitypolling logs on a specific host within the time period. - The longer an activity runs for, the more likely it will be that it will be sampled by pg_stat_activity fluentd polling, so this technique can be helpful in those situations.
- Since we only poll
pg_stat_activityonce a minute, this technique is fairly coarse-grained. - Use the Marginalia Sampler, which samples every 15s, to provide more correlation.
- Sample query: https://log.gprd.gitlab.net/goto/edfdd5a069b72195bb375b4bf5e3f5a0
- If there are queries you wish to investigate further, use the
fingerprintto lookup the query frompg_stat_statementsfluentd polling logs as described above.
Find out more details of a statement given a slowlog entry
Section titled “Find out more details of a statement given a slowlog entry”graph LR
subgraph slowlogs
F[fingerprint]
end
subgraph pg_stat_statements logs
F --> D[fingerprint]
D --> Q[queryid]
end
subgraph pg_stat_statements metrics
Q --> U[queryid]
end
- Each slowlog entry already has a
fingerprint. - You need to perform a lookup of the
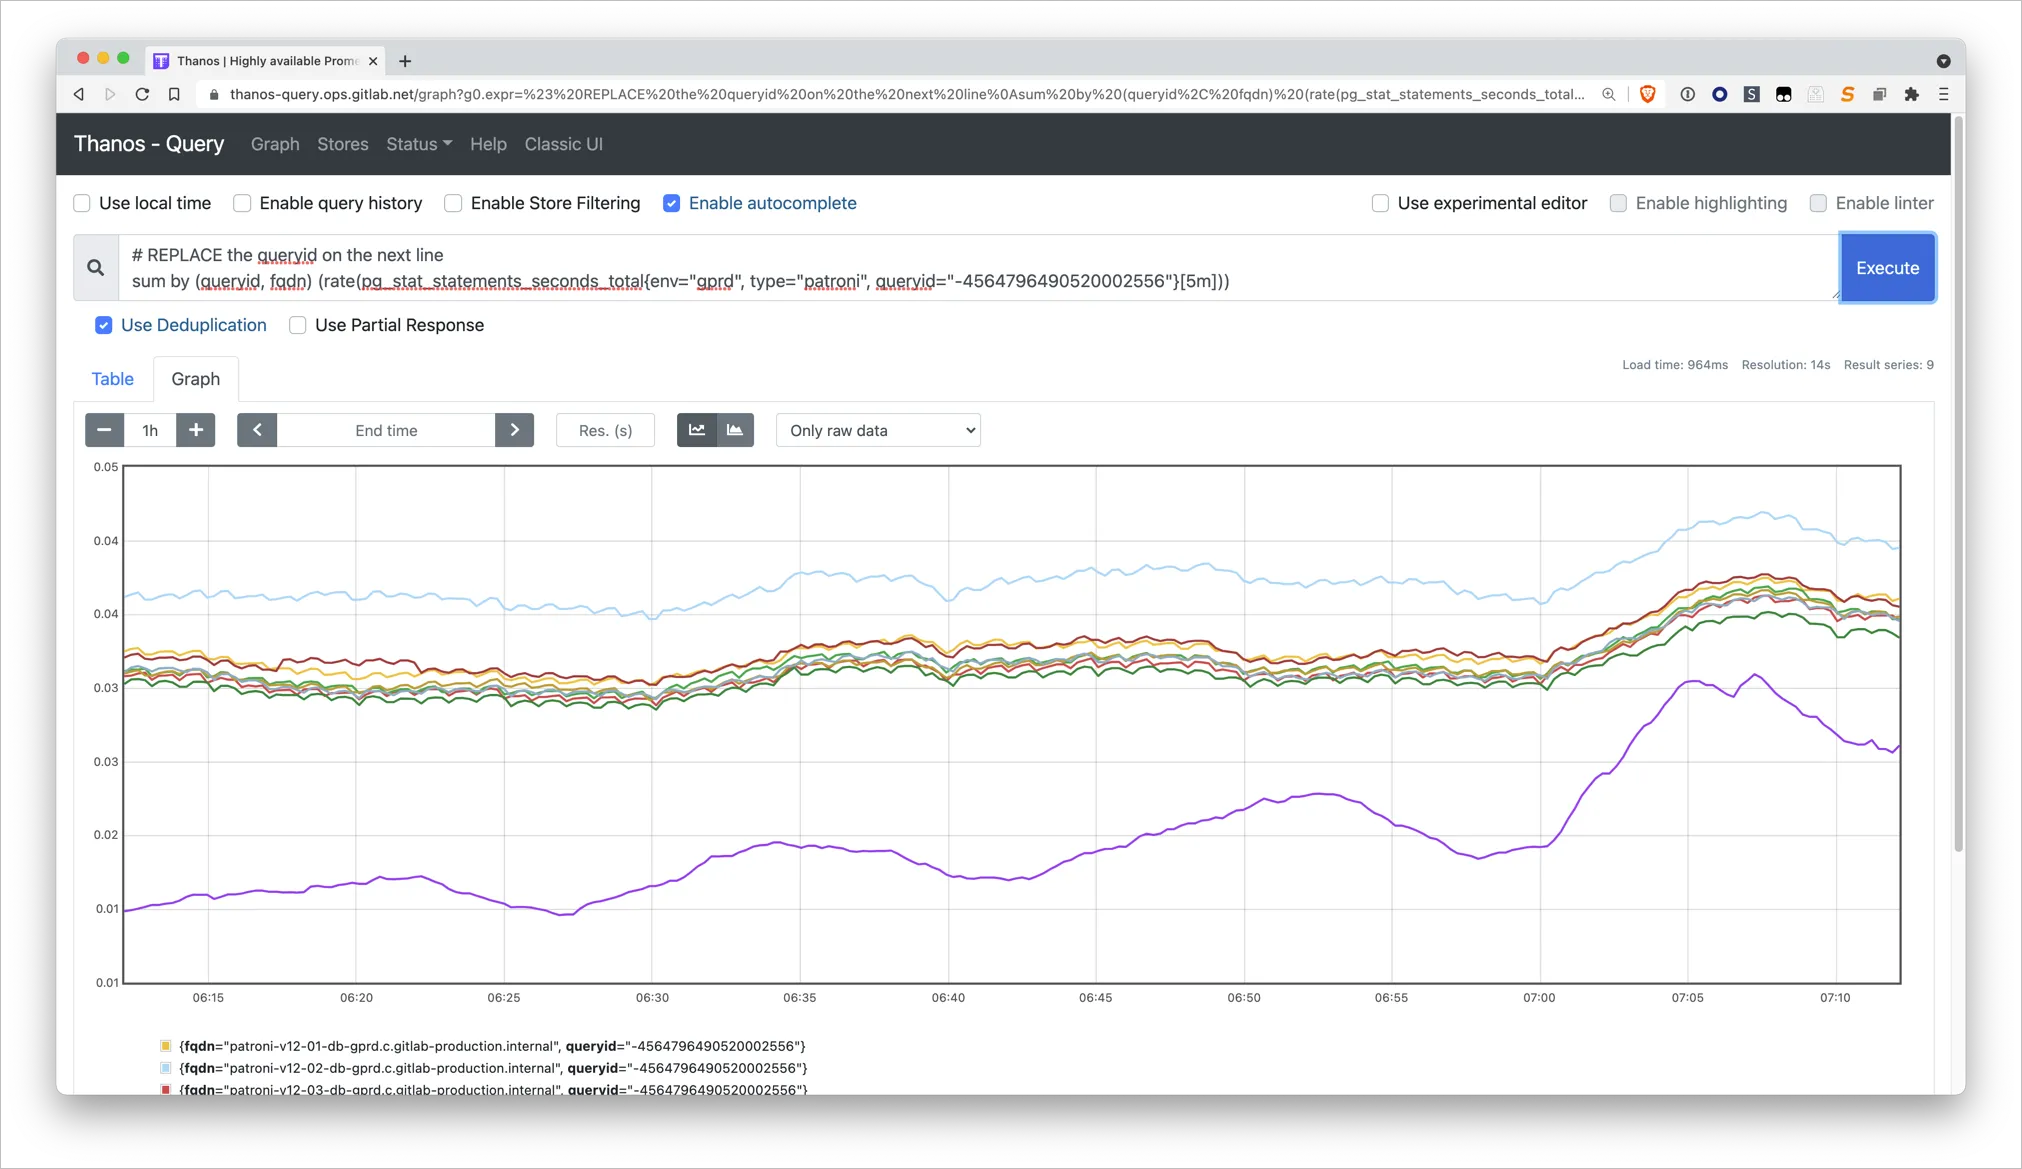
queryidusing thisfingerprintusing the technique described above to find thequeryid. - Use the
queryidto make queries in Thanos against thepg_stat_statements_*metrics:pg_stat_statements_calls,pg_stat_statements_rows,pg_stat_statements_seconds_total, etc