Monitoring Service
- Service Overview
- Alerts: https://alerts.gitlab.net/#/alerts?filter=%7Btype%3D%22monitoring%22%2C%20tier%3D%22inf%22%7D
- Label: gitlab-com/gl-infra/production~“Service::Prometheus”
Logging
Section titled “Logging”Introduction
Section titled “Introduction”This document describes the monitoring stack used by gitlab.com. “Monitoring stack” here implies “metrics stack”, concerning relatively low-cardinality, relatively cheap to store metrics that are our primary source of alerting criteria, and the first port of call for answering “known unknowns” about our production systems. Events, logs, and traces are out of scope.
We assume some basic familiarity with the Prometheus monitoring system, and the Mimir project, and encourage you to learn these basics before continuing.
The rest of this document aims to act as a high-level summary of how we use Prometheus and its ecosystem, but without actually referencing how this configuration is deployed. For example, we’ll describe the job sharding and service discovery configuration we use without actually pointing to the configuration management code that puts it into place. Hopefully this allows those onboarding to understand what’s happening without coupling the document to implementation details.
Backlog
Section titled “Backlog”| Service | Description | Backlog |
|---|---|---|
| ~“Service::Prometheus” | The multiple prometheus servers that we run. | gl-infra/infrastructure |
| ~“Service::Mimir” | Anything related to Mimir. | gl-infra/infrastructure |
| ~“Service::Grafana” | Anything related to https://dashboards.gitlab.net/ | gl-infra/infrastructure |
| ~“Service::AlertManager” | Anything related to AlertManager | gl-infra/infrastructure |
| ~“Service::Monitoring-Other” | The service we provide to engineers, this covers metrics, labels and anything else that doesn’t belong in the services above. | gl-infra/infrastructure |
Some of the issues in the backlog also belong in epics part of the Observability Work Queue Epic to group issues around a large project that needs to be addressed.
Querying
Section titled “Querying”Querying is done via grafana.
Dashboards
Section titled “Dashboards”Grafana dashboards on dashboards.gitlab.net are managed in 3 ways:
- By hand, editing directly using the Grafana UI
- Uploaded from https://gitlab.com/gitlab-com/runbooks/tree/master/dashboards, either:
- json - literally exported from grafana by hand, and added to that repo
- jsonnet - JSON generated using jsonnet/grafonnet; see https://gitlab.com/gitlab-com/runbooks/blob/master/dashboards/README.md
Instrumentation
Section titled “Instrumentation”We pull metrics using various Prometheus servers from Prometheus-compatible endpoints called “Prometheus exporters”. Where direct instrumentation is not included in a 3rd-party program, as is the case with pgbouncer, we deploy/write adapters in order to be able to ingest metrics into Prometheus.
Probably the most important exporter in our stack is the one in our own application. GitLab-the-app serves Prometheus metrics on a different TCP port to that on which it serves the application, a not-uncommon pattern among directly-instrumented applications.
Metrics
Section titled “Metrics”Without trying to reproduce the excellent Prometheus docs, it is worth briefly covering the “Prometheus way” of metric names and labels.
A Prometheus metric consists of a name, labels (a set of key-value pairs), and a floating point value. Prometheus periodically scrapes its configured targets, ingesting metrics returned by the exporter into its time-series database (TSDB), stamping them with the current time (unless the metrics are timestamped at source, a rare use-case). Some examples:
http_requests_total{status="200", route="/users/:user_id", method="GET"} 402http_requests_total{status="404", route="UNKNOWN", method="POST"} 66memory_in_use_bytes{} 10204000Note the lack of “external” context on each metric. Application authors can add intuitive instrumentation without worrying about having to relay environmental context such as which server group it is running in, or whether it’s production or not. Context can be added to metrics in a few places in its lifecycle:
- At scrape time, by relabeling in Prometheus service discovery configurations.
- Kubernetes / GCE labels can be functionally mapped to metric labels using custom rules.
- Static labels can be applied per scrape-job.
- e.g.
{type="gitaly", stage="main", shard="default"} - We tend to apply our standard labels at this level.
- This adds “external context” to metrics. Hostnames, service types, shards, stages, etc.
- If the metric is the result of a rule (whether recording or alerting), by
static labels on that rule definition.
- e.g. for an alert:
{severity="S1"}.
- e.g. for an alert:
- Static “external labels”, applied at the prometheus server level.
- e.g.
{env="gprd", monitor="db"} - These are added by prometheus when a metric is part of an alerting rule,
and sent to alertmanager, but are not stored in the TSDB and cannot be
queried.
- Note that these external labels are additional to the rule-level labels that might have already been defined - see point above.
- There was an open issue on prometheus to change this, but I can’t find it.
- These are also applied to series leaving prometheus via remote-write.
- Information about which environment an alert originates from can be useful for routing alerts: e.g. PagerDuty for production, Slack for non-production.
- e.g.
Scrape jobs
Section titled “Scrape jobs”Service discovery and labels
Section titled “Service discovery and labels”“Jobs” in Prometheus terminology are instructions to pull (“scrape”) metrics from a set of exporter endpoints. Typically, our GCE Prometheus nodes typically only monitor jobs that are themselves deployed via Chef to VMs, using static file service discovery, with the endpoints for each job and their labels populated by Chef from our Chef inventory.
Our GKE Prometheus nodes typically only monitor jobs deployed to Kubernetes, and as such use Kubernetes service discovery to build lists of endpoints and map pod/service labels to Prometheus labels.
A note about GitLab CI
Section titled “A note about GitLab CI”GitLab CI jobs run in their own Google Project. This is not peered with our ops VPC, as a layer of isolation of the arbitrary, untrusted jobs from any gitlab.com project, from our own infrastructure. There are Prometheus instances in that project that collect metrics, which have public IPs that only accept traffic from our gprd Prometheus instances, which federation-scrape metrics from it. The CI Prometheus instances are therefore not integrated with Alertmanager directly.
CI is undergoing somewhat of an overhaul, so this may well change fast.
Alerting
Section titled “Alerting”Prometheus rules
Section titled “Prometheus rules”We deploy the same set of rules (of both the alerting and recording variety) to all Prometheus instances. An advantage of this approach is that we get prod/nonprod parity almost for free, by evaluating the same (alerting) rules and relying on external labels to distinguish different environments in Alertmanager’s routing tree.
We exploit the fact that rule evaluation on null data is cheap and not an error: e.g. evaluating rules pertaining to postgresql metrics on non-DB shards still works, but emits no metrics.
Rules are uploaded to all Prometheus shards from here. This in turn comes from 2 places:
- Handwritten rules, in the various files.
- “Generic” rules, oriented around the 4 golden signals,
generated from jsonnet by the metrics-catalog.
- The metrics catalog is a big topic, please read its own docs linked above.
In Chef-managed Prometheus instances, the rules directory is periodically pulled down by chef-client, and Prometheus reloaded. For Kubernetes, the runbooks repo’s ops mirror pipeline processes the rules directory into a set of PrometheusRule CRDs, which are pushed to the clusters and picked up by Prometheus operator.
Mimir Ruler
Section titled “Mimir Ruler”Mimir Ruler is a component that evaluates Prometheus rules centrally from data sent from Prometheus, via remote-write, to Mimir. Metrics are therefore available from all environments and shards, and external labels are available.
Rules are defined in runbooks/mimir-rules, which is populated from jsonnet in runbooks/mimir-rules-jsonnet.
Alertmanager
Section titled “Alertmanager”We run a single Alertmanager service. It runs in our ops cluster. All Prometheus instances (and mimir ruler, which can send alerts) make direct connections to each Alertmanager pod. This is made possible by:
- The use of “VPC-native” GKE clusters, in which pod CIDRs are GCE subnets, therefore routable in the same way as VMs.
- We VPC-peer ops to all other VPCs (except CI) in a hub and spoke model.
- The use of external-dns on a headless service to allow pod IP service discovery via a public A record.
The alertmanager routing tree is defined in runbooks.
Scaling Prometheus (Mimir)
Section titled “Scaling Prometheus (Mimir)”In the “Job partitioning” section above we’ve already discussed how Prometheus’ write/alerting path is sharded by scrape job. This gives us some problems in the read/query path though:
- Queriers (whether dashboards or ad-hoc via the web console) need to know which Prometheus shard will contain a given metric.
- Queries must arbitrarily target one member of a redundant Prometheus pair, which may well be missing data from when it was restarted in a rolling deployment.
- We can’t keep metrics on disk forever, this is expensive. Large indexes increase memory pressure on Prometheus
The Mimir project aims to solve all of these problems:
- A Unified query interface: cross-Prometheus, de-duplicated queries
- Longer-term, cheaper metrics storage: object storage, downsampling of old metrics.
You can see more about our implementation here
meta-monitoring
Section titled “meta-monitoring”We must monitor our monitoring stack! This is a nuanced area, and it’s easy to go wrong.
Cross-shard monitoring
Section titled “Cross-shard monitoring”- Within an environment, the default shard in GCE monitors the other shards (app, db).
- “Monitors” in this context simply means that we have alerting rules for Prometheus being down / not functioning: https://gitlab.com/gitlab-com/runbooks/-/blob/master/legacy-prometheus-rules/default/prometheus-metamons.yml
- This is in a state of flux: The GKE shard is not part of this type of meta-monitoring. A pragmatic improvement would be to have the default-GKE shards monitor any other GKE shards (“app” when it exists), and eventually turn down the GCE shards by migrating GCE jobs to GKE Prometheus instances.
- All Prometheus instances monitor the Alertmanager: https://gitlab.com/gitlab-com/runbooks/-/blob/master/legacy-prometheus-rules/alertmanager.yml
- There is likely a hole in this setup since we introduced zonal clusters: we might not be attuned to monitoring outages there. See issue.
- Observant readers will have noticed that monitoring Prometheus/Alertmanager is all well and good, but if we’re failing to send Alertmanager notifications then how can we know about it? That brings us to the next section.
Alerting failure modes
Section titled “Alerting failure modes”- Our urgent Alertmanager integration is Pagerduty. When PagerDuty itself is down, we have no backup urgent alerting system and rely on online team members noticing non-paging pathways such as Slack to tell us of this fact.
- Our less-urgent Alertmanager integrations are Slack, and GitLab issues.
- If Alertmanager is failing to send notifications due to a particular integration failing, it will trigger a paging alert. Our paging alerts all also go to the Slack integration. In this way we are paged for non-paging integration failures, and only Slack-notified of failures to page. This is a little paradoxical, but in the absence of a backup paging system this is what we can do.
- If Alertmanager is failing to send all notifications, e.g. because it is down,
we should get a notification from Dead Man’s Snitch,
which is a web service implementation of a dead man’s switch.
- We have always-firing “SnitchHeartBeat” alerts configured on all Prometheus shards, with snitches configured for each default shard (both GCE and GKE).
- If a default shard can’t check in via the Alertmanager, we’ll get notified.
- If the Alertmanager itself is down, all snitches will notify.
External black-box monitoring
Section titled “External black-box monitoring”Finally, we also use an external third-party service, Pingdom, to notify us when certain public services (e.g. gitlab.com) are down to it, as a last line of defence.
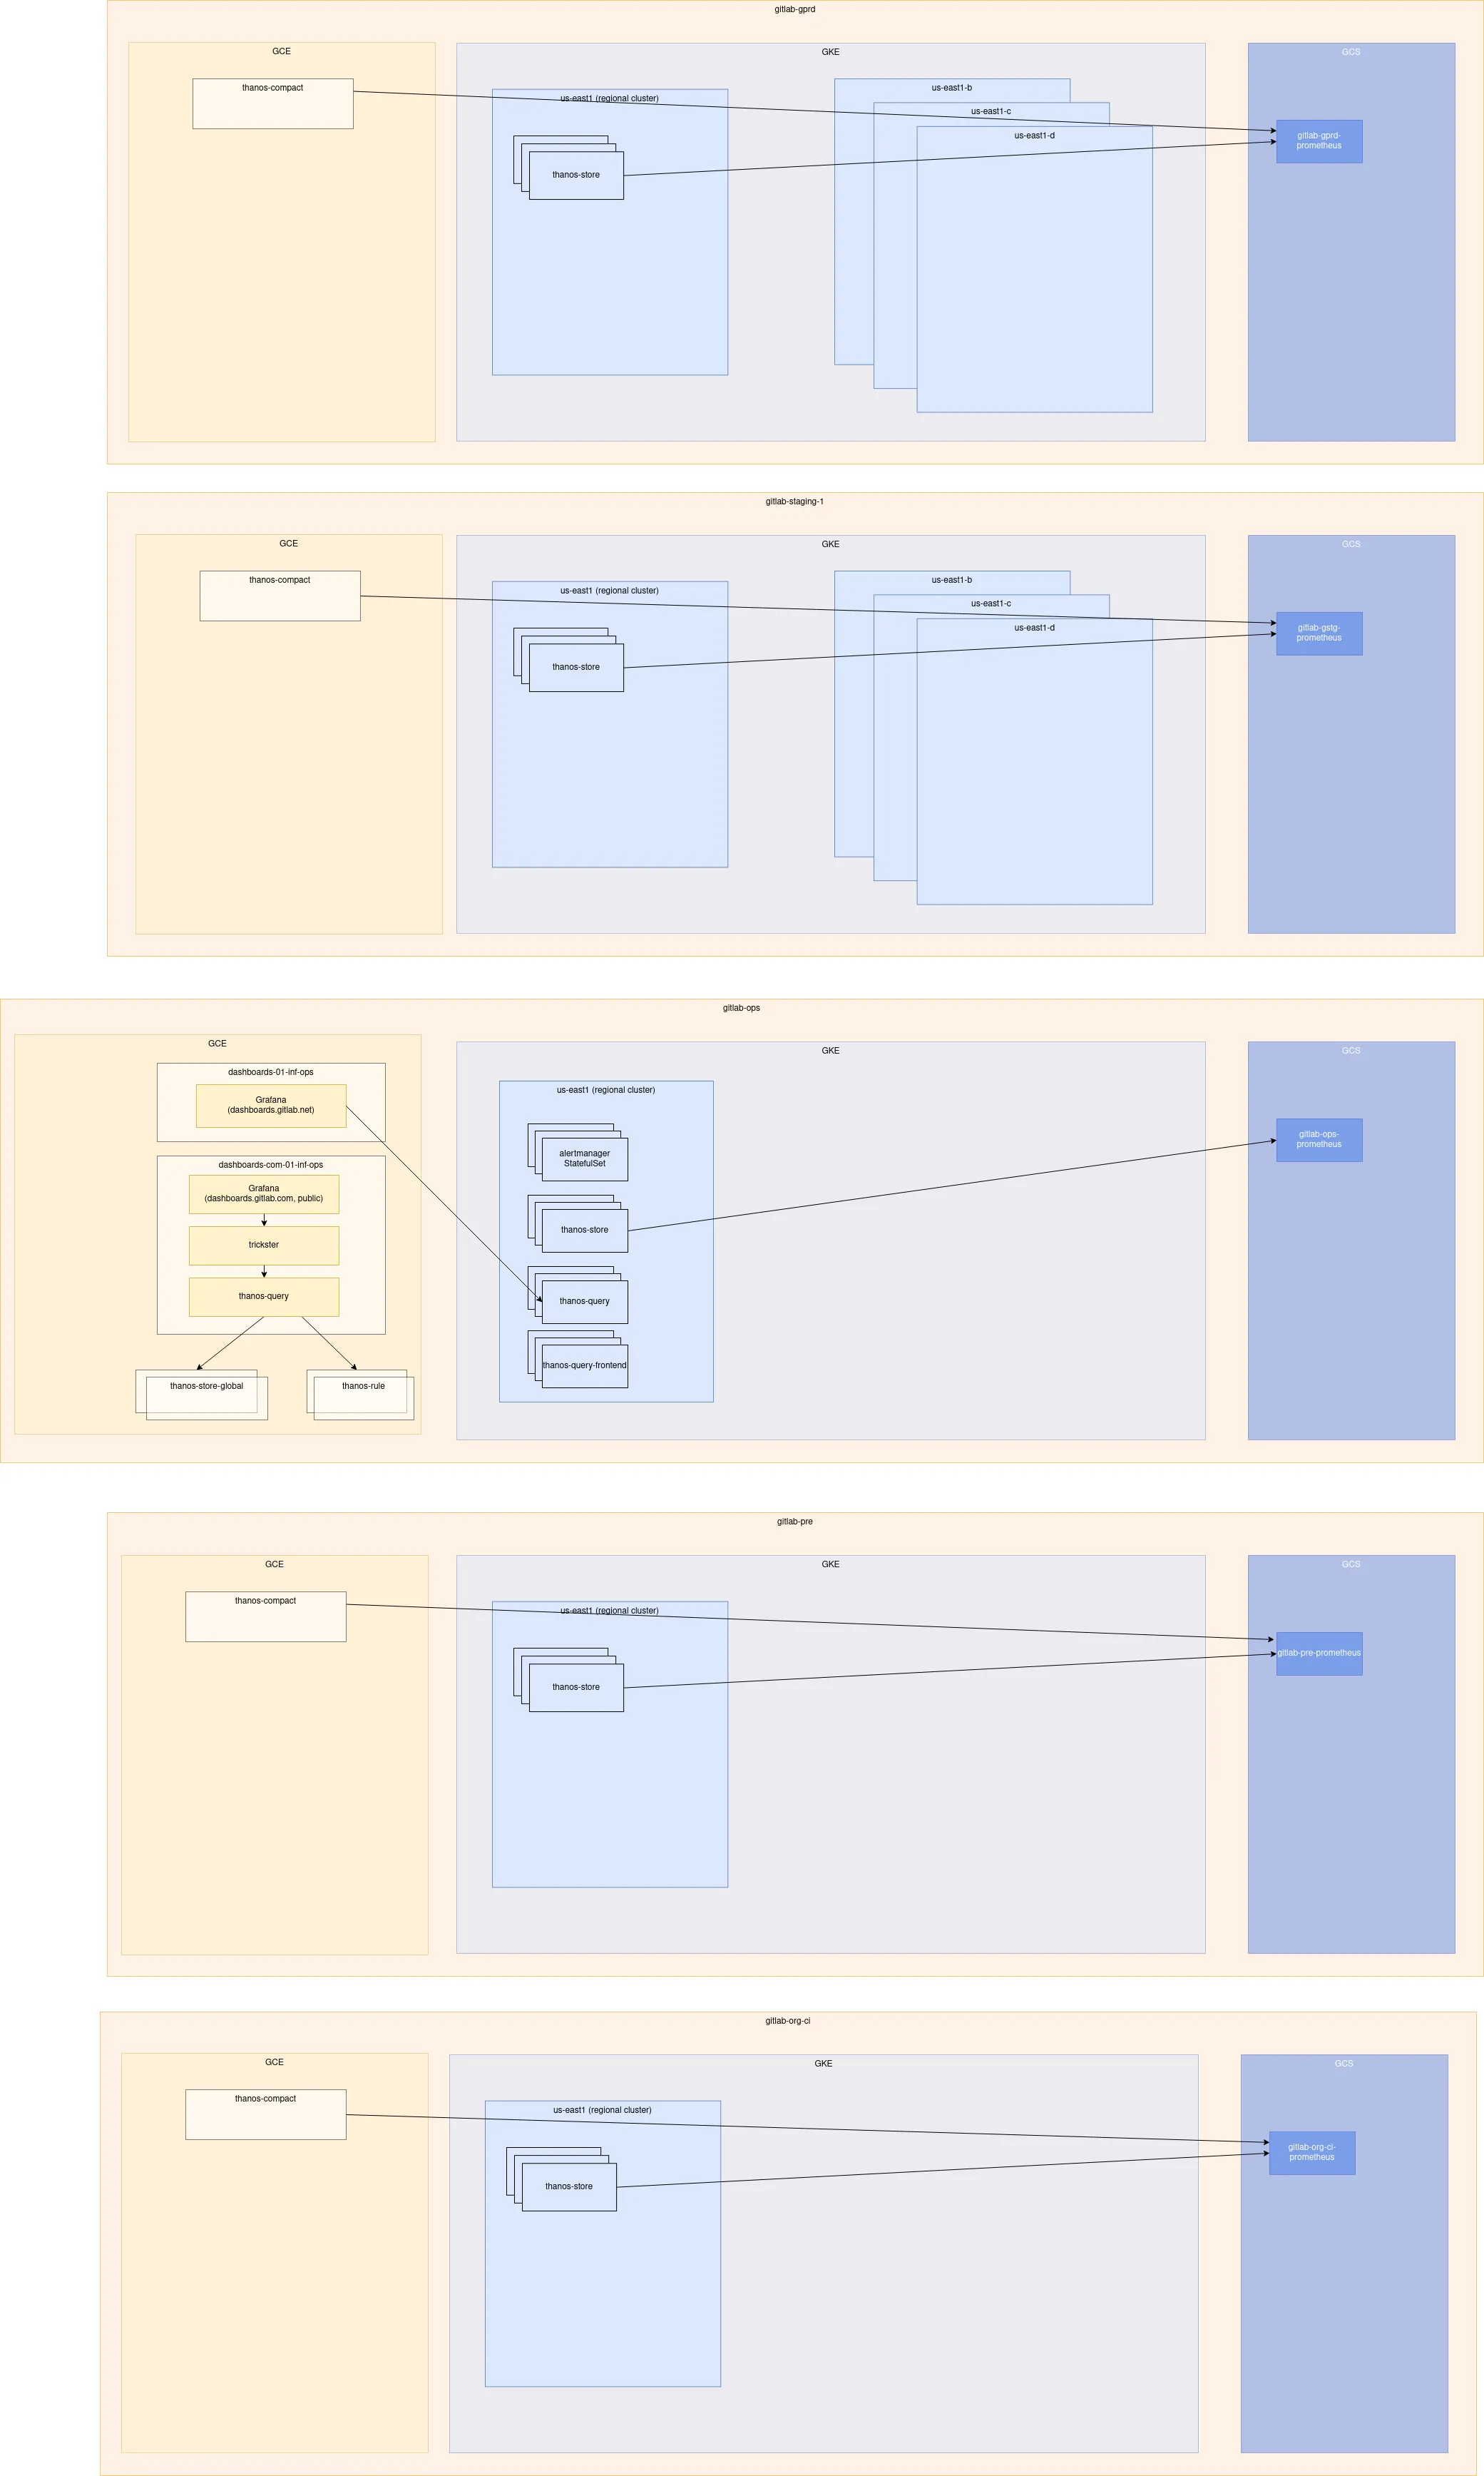
Architecture
Section titled “Architecture”The current architecture is best viewed in the Mimir docs
Performance
Section titled “Performance”Scalability
Section titled “Scalability”Availability
Section titled “Availability”Durability
Section titled “Durability”Security/Compliance
Section titled “Security/Compliance”Monitoring/Alerting
Section titled “Monitoring/Alerting”Links to further Documentation
Section titled “Links to further Documentation”- “Prometheus: Up & Running” book
- https://about.gitlab.com/handbook/engineering/monitoring
- https://about.gitlab.com/handbook/engineering/monitoring/#related-videos
- A recent “Prometheus 101” video (private, you’ll need a “GitLab Unfiltered” Youtube login).
- Monitoring infrastructure overview
- Monitoring infrastructure troubleshooting
- Metrics catalog README
- Apdex alert guide
- video: delivery: intro to monitoring at gitlab.com
- epic about figuring out and documenting monitoring
- video: General metrics and anomaly detection
- ./alerts_manual.md
- ./common-tasks.md
- Incident Diagnosis in a Symptom-based World