Google Cloud Metrics Investigation
Overview
Section titled “Overview”When investigating traffic irregularities, Google Cloud Platform metrics provide valuable insights into system behavior. The “sent bytes” and “received bytes” metrics are particularly useful for recent incidents as it helps identify unusual traffic patterns.
Locating Metrics in Google Cloud
Section titled “Locating Metrics in Google Cloud”The relevant metrics for traffic investigation are found under the compute.googleapis.com namespace in Google Cloud Monitoring. These metrics are retained for 24 months according to the data retention policy.
Key Metrics: Sent Bytes and Received Bytes
Section titled “Key Metrics: Sent Bytes and Received Bytes”The “sent bytes” metric tracks outbound network traffic from compute instances and the “received bytes” metric tracks inbound network traffic from compute instances.They are crucial for:
- Identifying traffic spikes
- Detecting unusual data transfer patterns
- Pinpointing the specific machines responsible for irregularities
Investigation Workflow
Section titled “Investigation Workflow”Step 1: Identify Problem Machines
Section titled “Step 1: Identify Problem Machines”-
Navigate to Google Cloud Monitoring
-
Select the project you want to query
-
Query the
compute.googleapis.comnamespace for sent bytes metrics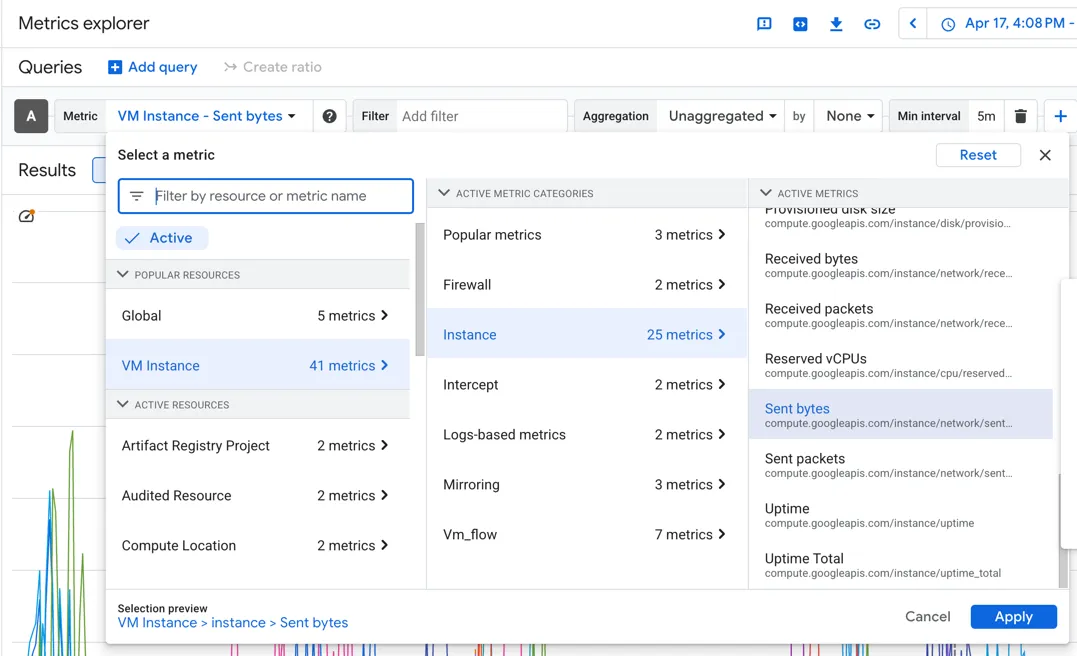
-
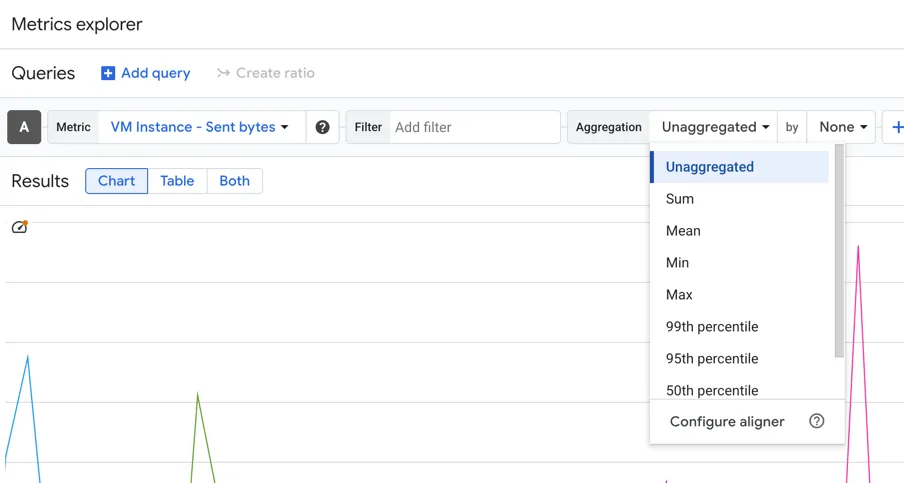
Set Aggregation to “Unaggregated”
-
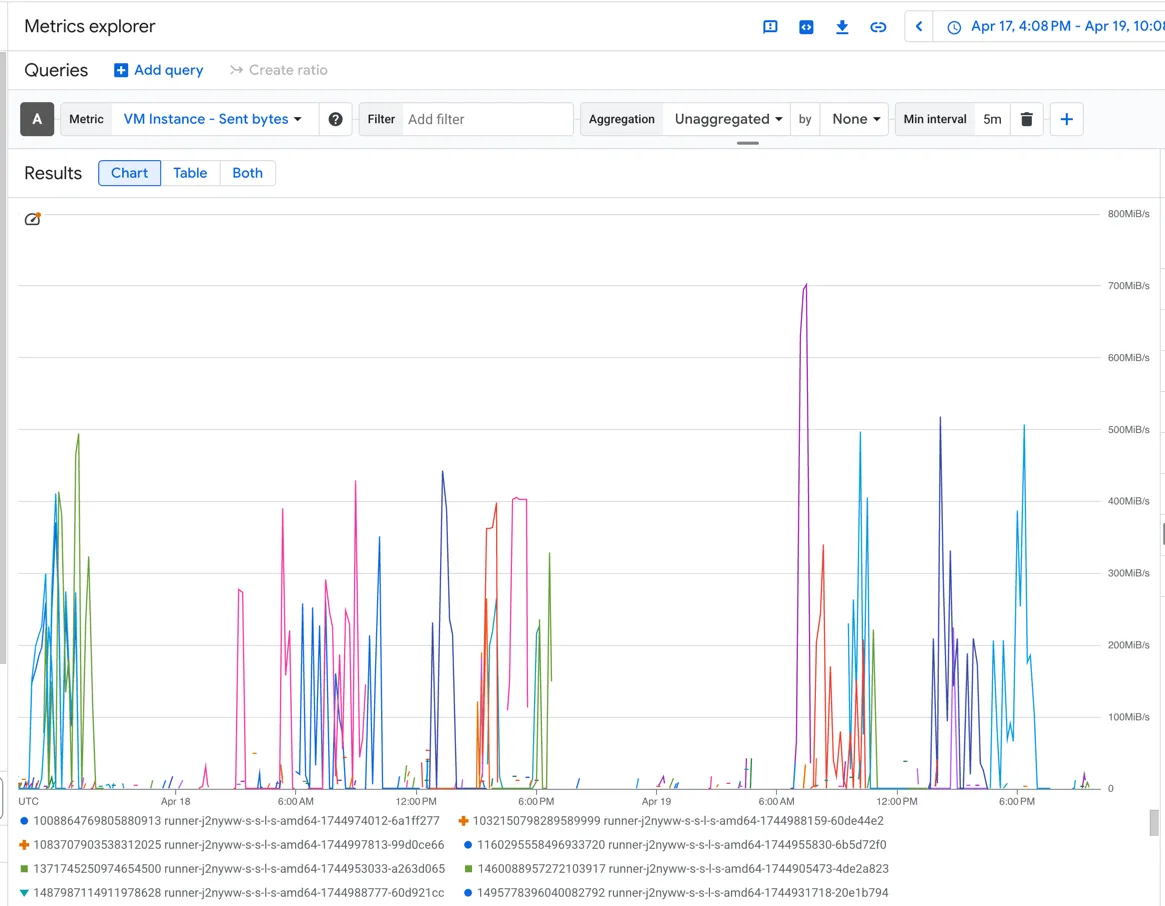
Filter by time range to isolate the incident period
-
Identify instances with abnormal traffic patterns
-
Optional: further filter by clicking the + sign above the graph and add a “Min interval” to aggregate metrics by different time windows.
Step 2: Cross-Reference with Kibana Logs
Section titled “Step 2: Cross-Reference with Kibana Logs”Once you’ve identified the problematic machines from GCP metrics:
- Query Kibana logs for the specific machine IDs/names
- Analyze detailed logs to understand the context of the jobs
Example cross-reference search
Section titled “Example cross-reference search”-
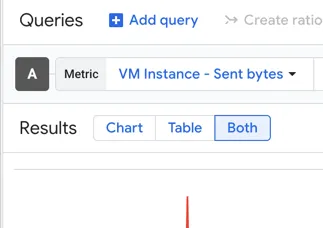
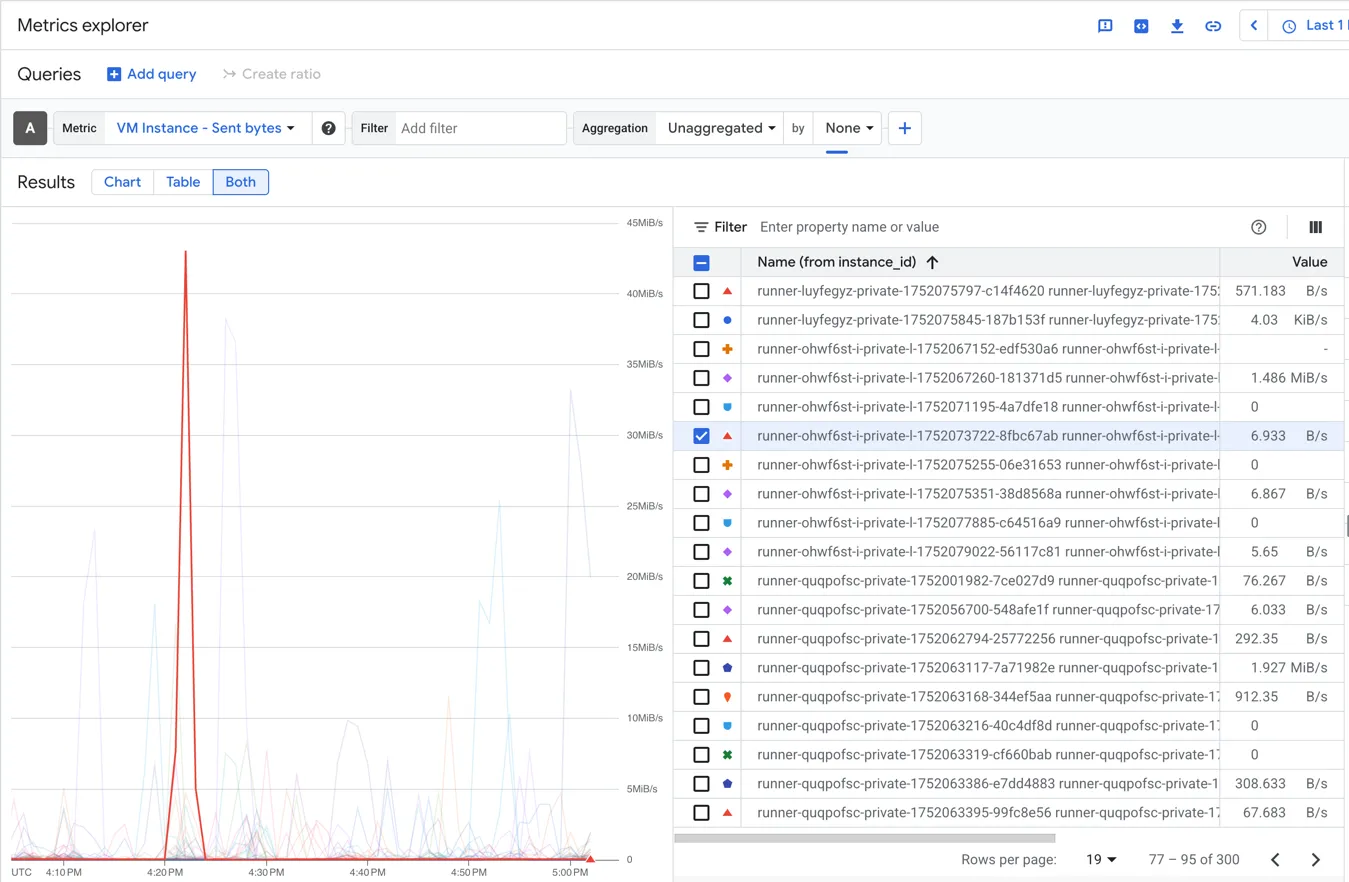
In GCP Metrics explorer, change the results type to “Both”
-
Click the line of the instance you want to search, then in the rights side panel, navigate through the list until you find the checked box.
-
Copy the instance name, beginning with
runner-and ending in a 8 character hash.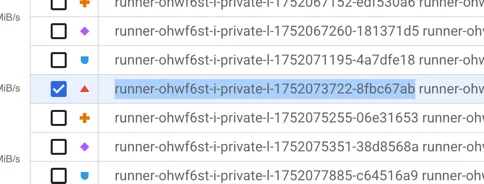
-
In Kibana, set the data view to
pubsub-runner-inf-gprd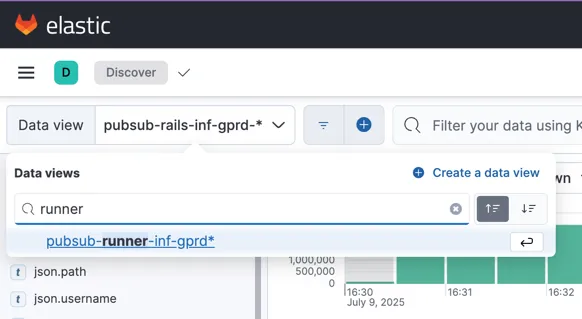
-
Click the plus sign to the right of the Data View field, and search for the
json.namefield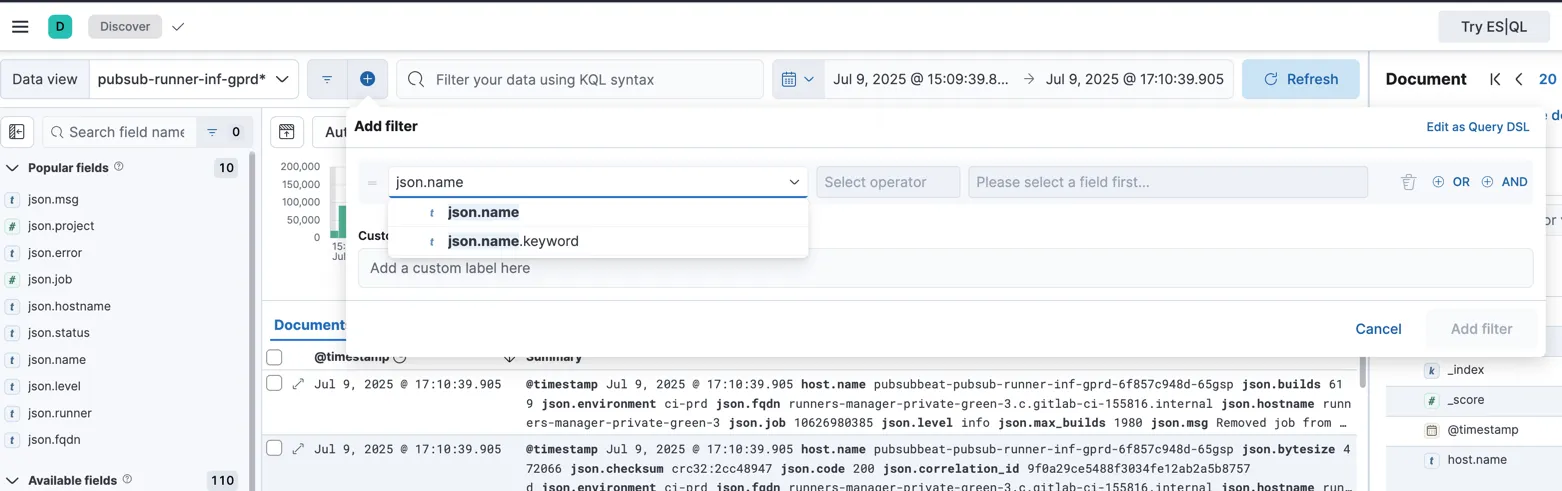
-
Set the operator to
isand paste the runner name into the field. Click to add the filter.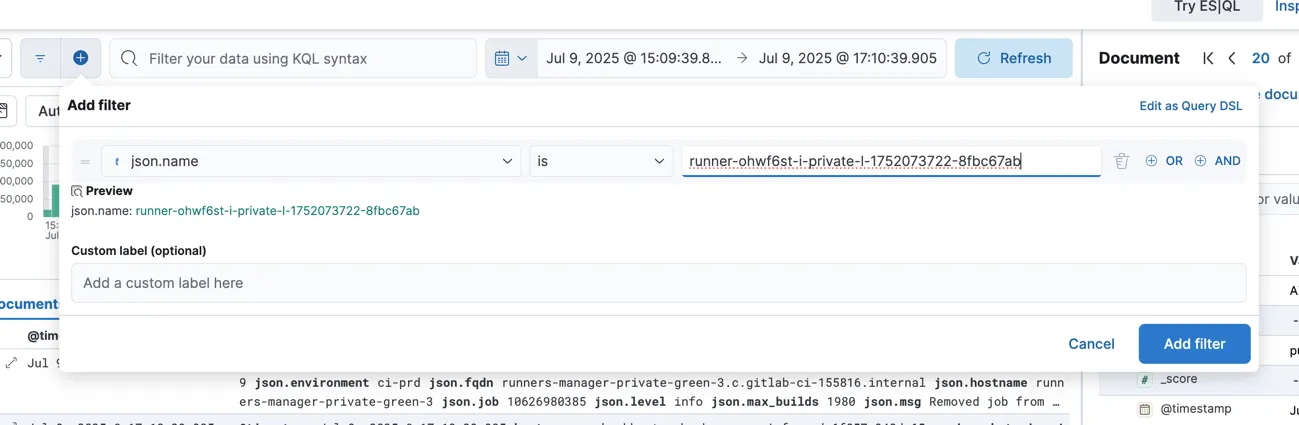
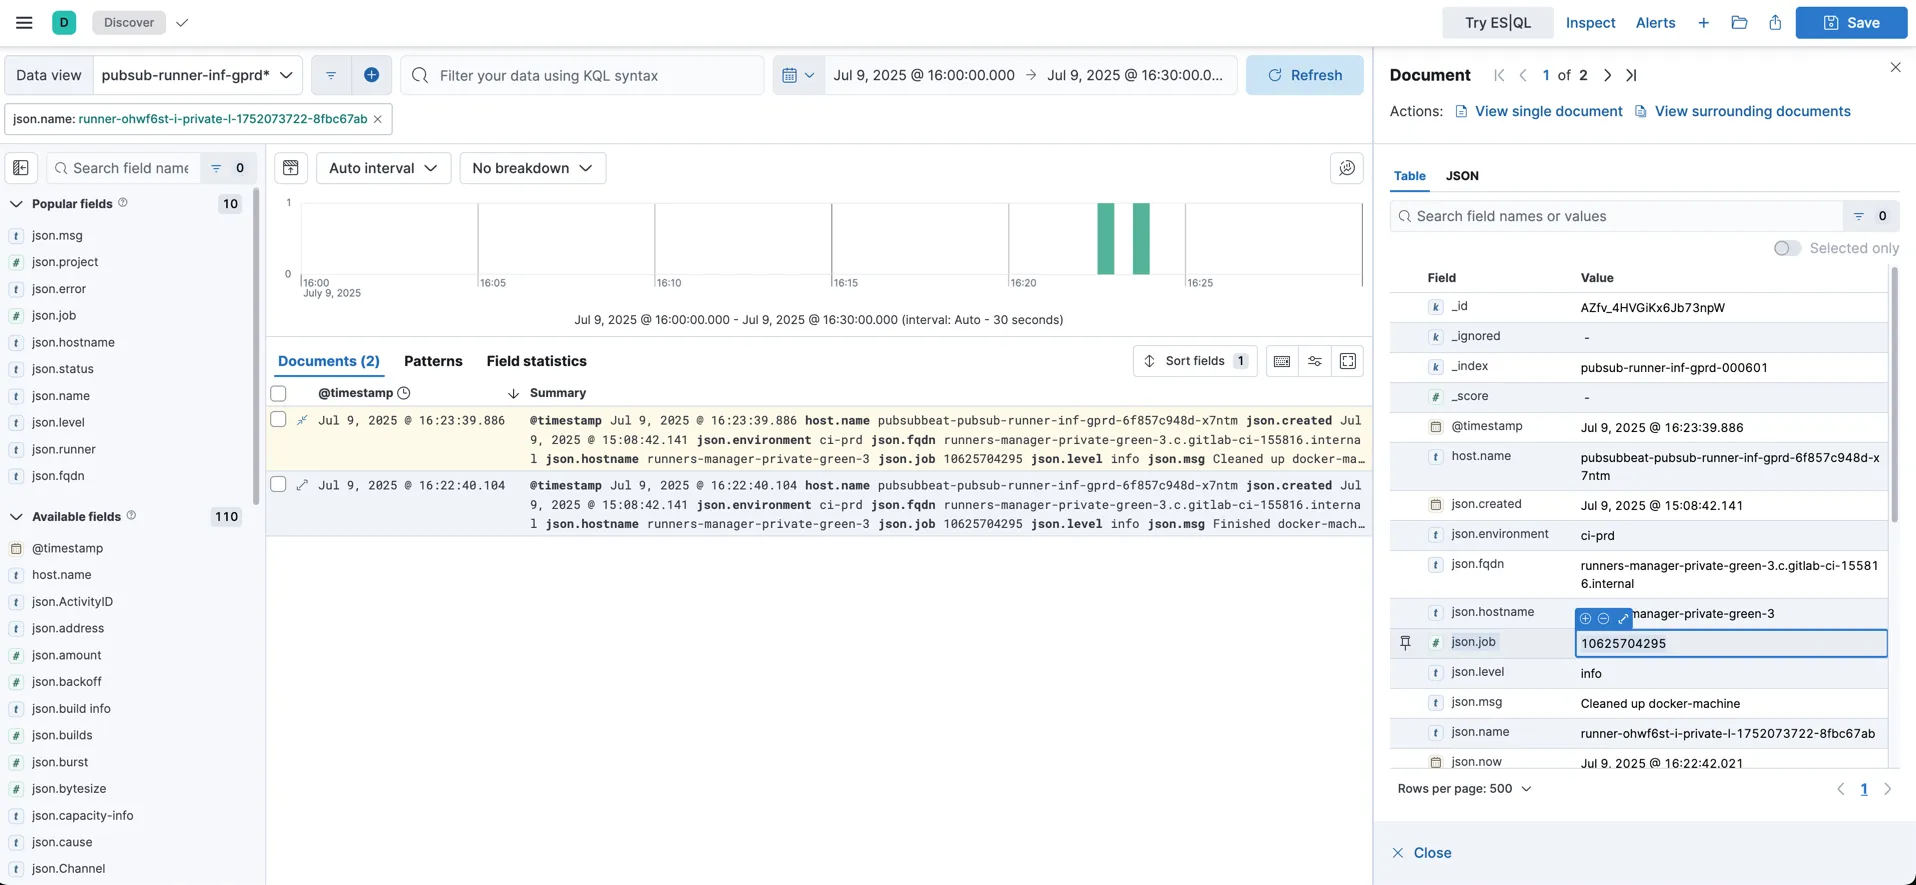
-
Ensure the time range of the search matches the time of the metric reading for the instance.
-
From the results, more information can be retrieved, like the project id and job id.
Getting the project URL
Section titled “Getting the project URL”- Follow the steps above for an example cross-reference search.
- Copy the
json.jobfrom a log result. - Filter for that
json.jobas well asjson.msg == "Added job to processing list". - The result will contain a field named
json.repo_url: the project associated with the job.
Important Log Retention Limitations
Section titled “Important Log Retention Limitations”Kibana Logs
Section titled “Kibana Logs”- Retention period: 30 days
- Expansion request: There is an open issue to extend this policy (GitLab Observability Issue #4123)
Accessing Older Logs
Section titled “Accessing Older Logs”If you need logs that are:
- Older than 30 days
- But within 365 days
Logs are also stored in a GCS bucket for long-term storage.