Grafana Mimir Service
- Service Overview
- Alerts: https://alerts.gitlab.net/#/alerts?filter=%7Btype%3D%22mimir%22%2C%20tier%3D%22inf%22%7D
- Label: gitlab-com/gl-infra/production~“Service::Mimir”
Logging
Section titled “Logging”Quick Links
Section titled “Quick Links”| Reference | Link |
|---|---|
| Helm Deployment | helmfiles |
| Tenant Configuration | config-mgmt |
| Runbooks | Grafana Runbooks |
| Dashboards | Mimir Overview |
| Logs | Elastic Cloud |
Troubleshooting
Section titled “Troubleshooting”If you received a page for Mimir, the first thing is to determine if the problem is on the write path, read path, or with recording rule evaluation.
As well as checking if the problem is isolated to a single tenant, or effecting all tenants.
We have some useful dashboards to reference for a quick view of system health:
There are other useful operational dashboards you can navigate to from the top right, under “Mimir dashboards”.
When checking tenants, the key metrics/questions here are:
- Is the tenant exceeding a quota?
- To increase quotas, see the getting-started docs.
- Is the “Newest seen sample age” recent.
- If there is no recent samples coming in, this could indicate the remote-write client may be experiencing issues and not sending any data.
- Are any series being dropped under “Distributor and ingester discarded samples rate”.
- Dropped samples would usually be the effect of a quota being exceeded so refer to the quota point above.
It’s also worth checking the observability alerts channel on slack #g_infra_observability_alerts,
as there is some much more targeted alerting that will have direct links to appropriate runbooks.
Runbooks
Section titled “Runbooks”We use a slightly refactored version of the Grafana Monitoring Mixin for much of the operational monitoring.
As such the Grafana Runbooks apply to our alerts as well, and are the best source of information for troubleshooting:
Onboarding
Section titled “Onboarding”See the getting-started readme
Cardinality Management
Section titled “Cardinality Management”Metrics cardinality is the silent performance killer in Prometheus.
Start with the cardinality-management readme to help identify problem metrics.
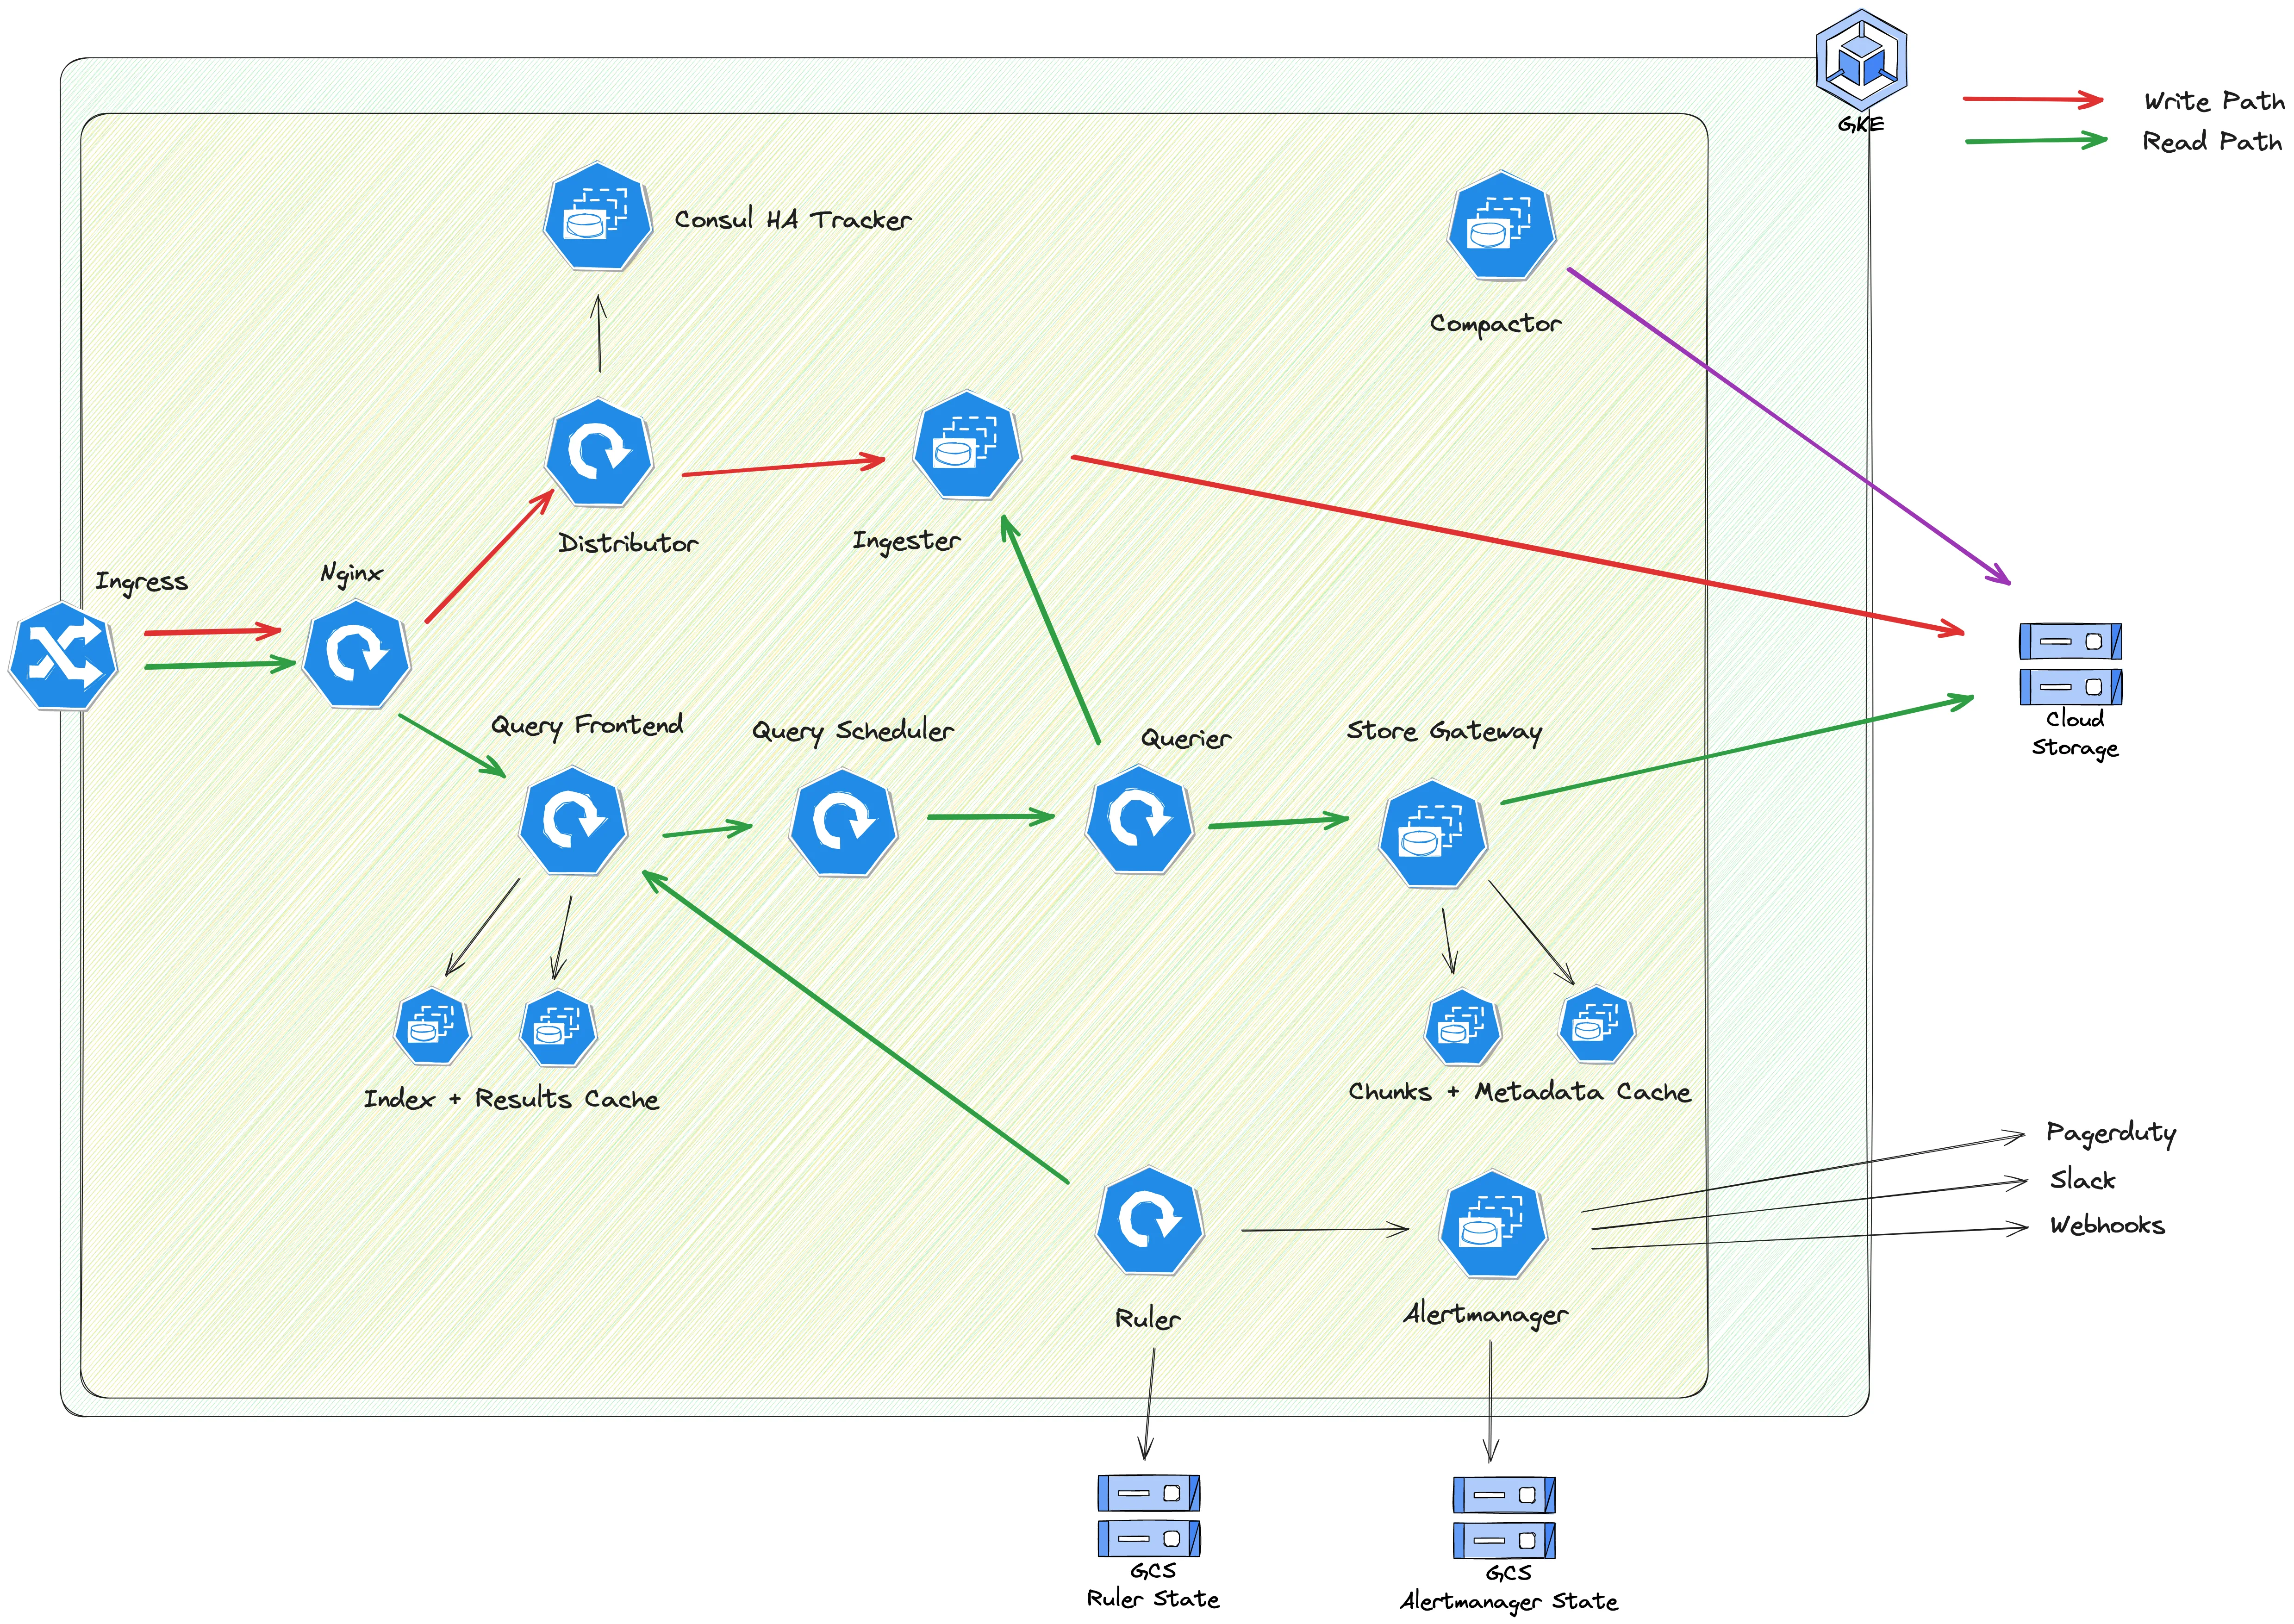
Architecture
Section titled “Architecture”We deploy in the microservices mode via helmfiles.
There are additional GCP components deployed via the helm chart using config-connector.
This includes storage buckets and IAM policies. These componets are deployed to the gitlab-observability GCP project, as this keeps the config connector permissions scoped and blast radius limited to the observability services.
Capacity Planning
Section titled “Capacity Planning”There is some good capacity planning docs from Grafana here.
These include some guidelines around sizing for various components in Mimir.
Keep in mind that at GitLab we have some incredibly high cardinality metrics, and while these numbers serve as good guidelines we often require more resources than recommended.
Scaling Mimir
Section titled “Scaling Mimir”Scaling up
Section titled “Scaling up”All components in Mimir are horizontally scalable.
We have autoscaling in place for the following components:
- Distributor
- Querier
- Query-Frontend
All components can be scaled up without concern.
The main consideration with scaling up is that with shuffle sharding enabled, new pods might not pick up workloads depending on shard assignments.
There is a runbook for the various component explaining the cause and fix in more detail.
Scaling down
Section titled “Scaling down”Scaling down for stateless components can be done without issue, with only the usual concerns for saturation and ensuring enough resource is left available.
There are several stateful components in Mimir that require special consideration when scaling down.
- Alertmanagers
- Ingesters
- Store-Gateways
Scaling down these needs to be done following a process as they contain recent data used for querying, unexpected removal of this data can cause missing datapoints.
More details on scaling down these components can be read here