Cardinality Management
There are a couple of great articles from Grafana around Cardinality which are worth a read before starting:
Following the second article which references Grafana Cloud, we have implemented a similar set of dashboards you can leverage to dig into cardinality:
Example
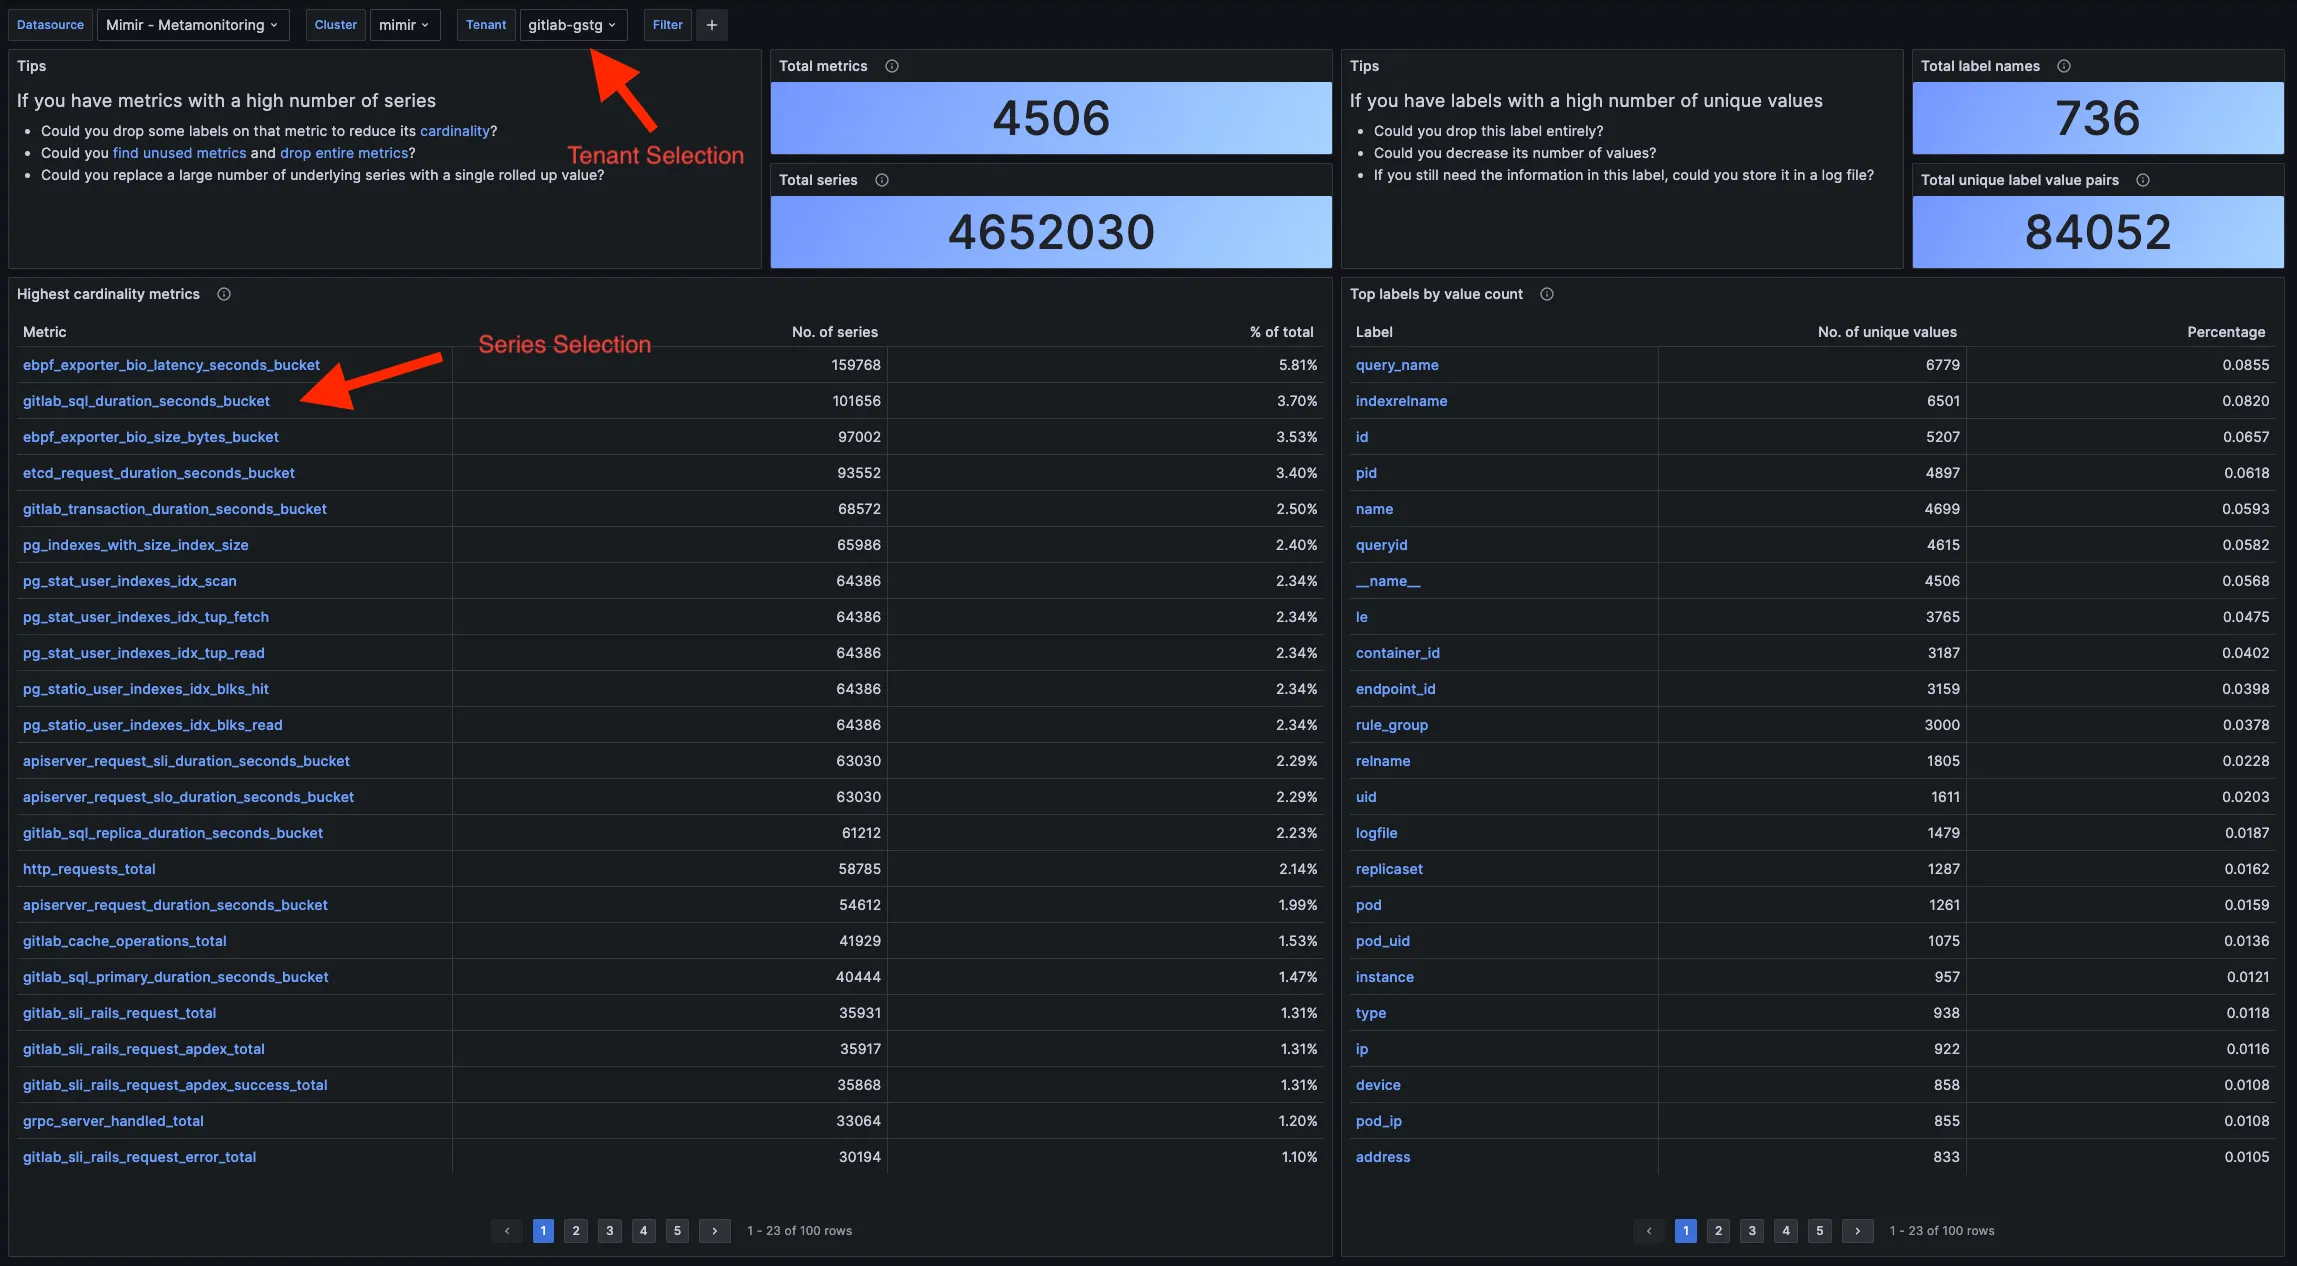
Section titled “Example”Looking at the overview page we have selected the tenant gitlab-gstg.
From this view we have a few pieces of information:
- Total Metrics
- Total Series
- Total Unique Label Names
- Total Unique Label/Value Pairs
- Highest Cardinality Metrics
- Top Labels by Value count
Lets pick the gitlab_sql_duration_seconds_bucket metric.
If we click on that series, it will take us to a series drill down dashboard.
This view drills into the series and shows us a tree map which shows the label names with the highest amount of unique values.
In this example we can see endpoint_id is the largest label consumer with 987 unique values.
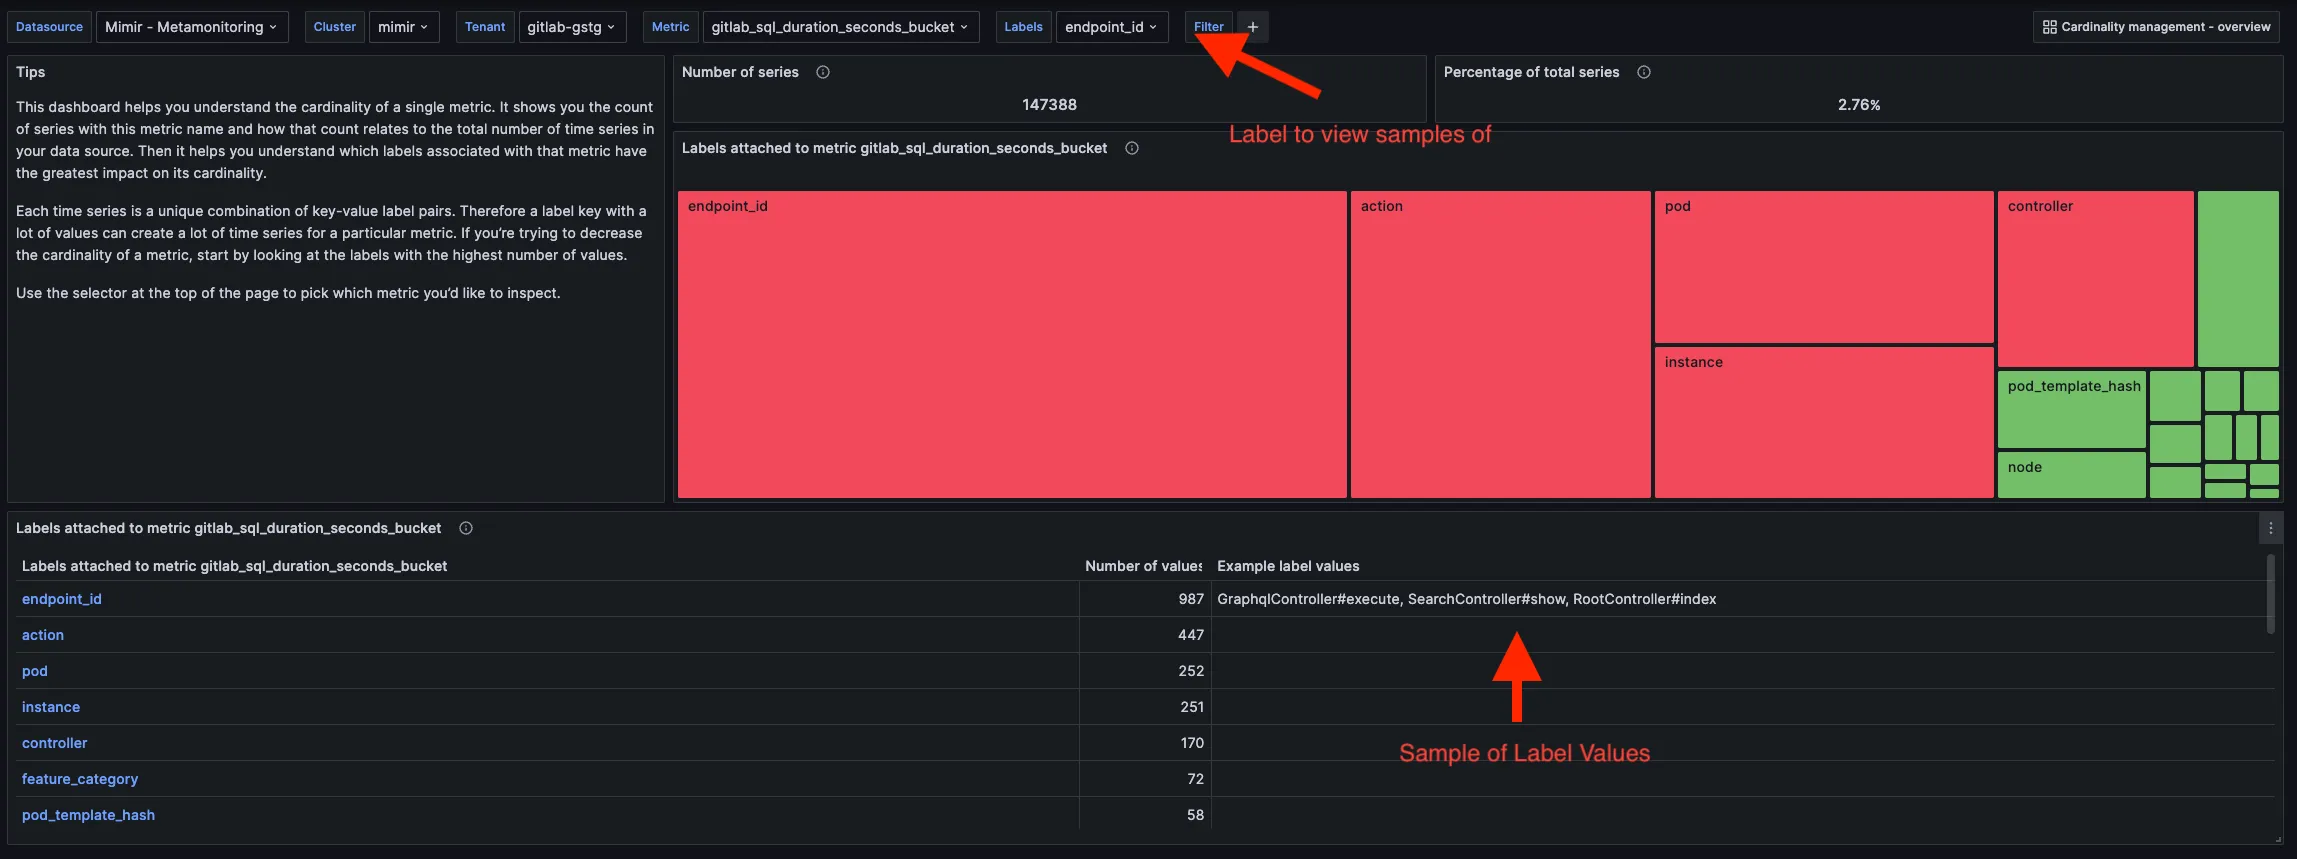
If we now click on endpoint_id from the tree map, we can go into a drill down of this label.
This will take us to a label view where we can see data for this specific label.
Including unique values, and other series using the label/value pairs.
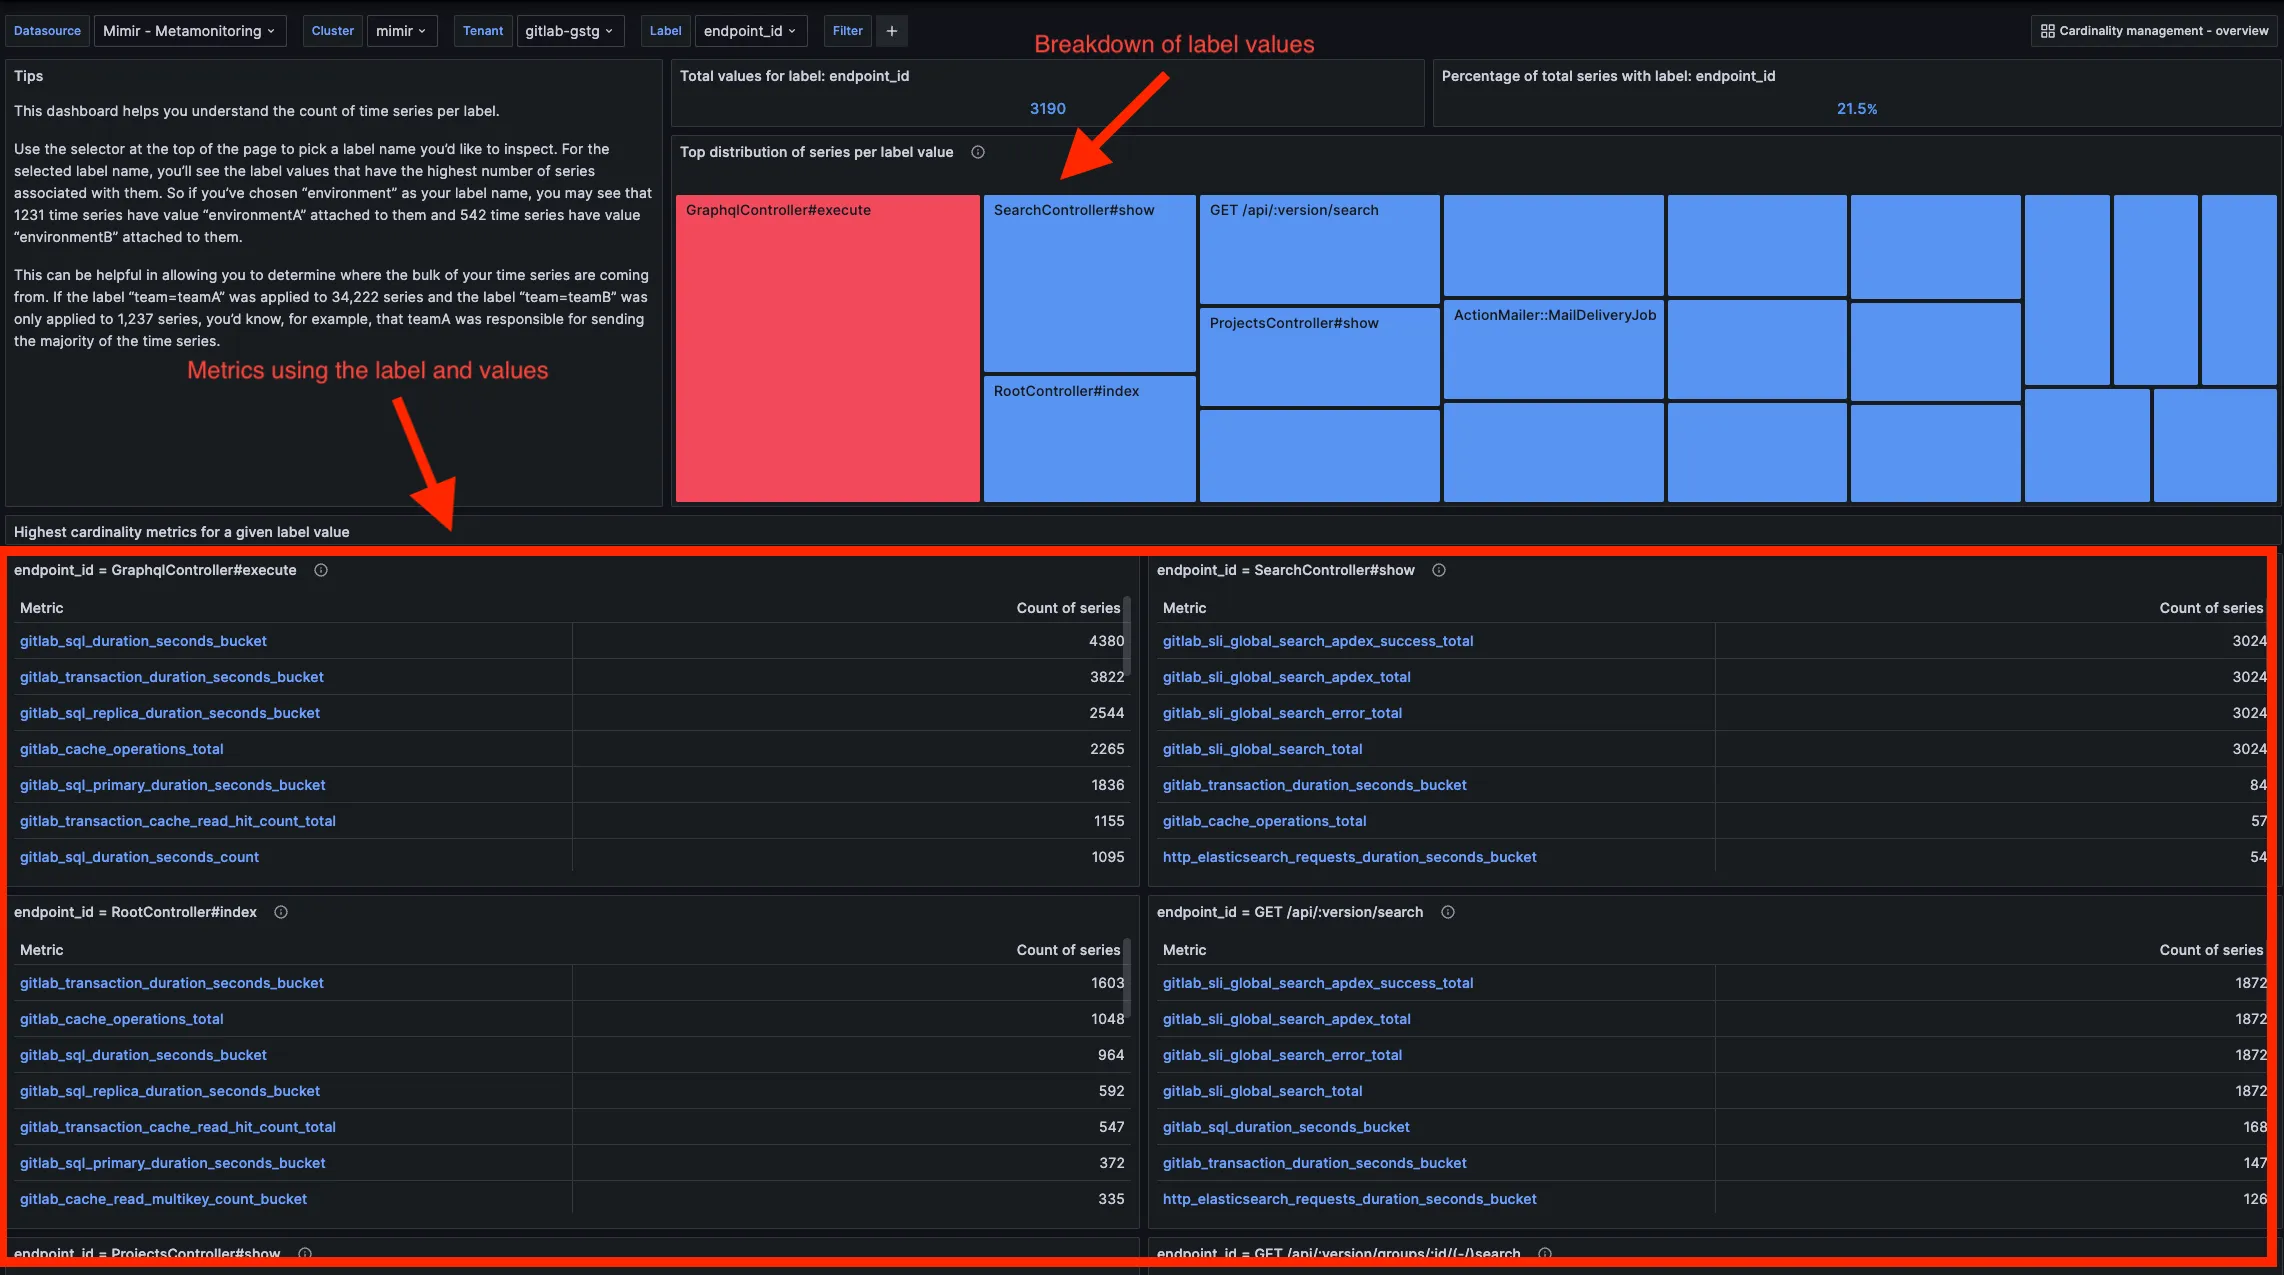
With this data, in this specific example we might be asking:
- How useful is this label?
- What about the unique values, can some of these values be dropped?
- Does it need to be present in all the listed metrics?
Questions like these can help us drastically improve metric performance, as well as our operating costs.