pgbadger Runbook
Here the link to the video of the runbook simulation.
pgbadger is a free tool that can help to generate a fast interactive HTML report from PostgreSQL’s logs, it is very useful when you want to analyze logs with a lot of info. The report from pgbadger is about queries (it is always logged when the query time is greater than log_min_duration_statement parameter ), connections, vacuum, lock, errors and others stuff
Use in GitLab
Section titled “Use in GitLab”The first step is to detect the values of two PostgreSQL’s parameters, in case of GitLab are the following:
show log_destination; log_destination----------------- csvlog(1 row)
show log_line_prefix;                   log_line_prefix----------------------------------------------------- %m [%p, %x]: [%l-1] user=%u,db=%d,app=%a,client=%h
The following flags of pgbadger to analyze logs are depending on the previous result:
--format csv--prefix '%m [%p, %x]: [%l-1] user=%u,db=%d,app=%a,client=%h'--csv-separator ','Example of use: The GitLab postgreSQL’s log are located in /var/log/gitlab/postgresql
#copy log files from DB serverscp -F ~/.ssh/ssh-file patroni-N-db-gprd.c.gitlab-production.internal:/var/log/gitlab/postgresql/postgresql.cs* .
###If not have permission with your user, can copy to your home and then copy scp command or can streaming via `ssh`:
# zip files (zcat) ssh -F ~/.ssh/ssh-file patroni-N-db-gprd.c.gitlab-production.internal "sudo zcat /var/log/gitlab/postgresql/postgresql.csv.3.gz" > postgresql.csv.3 # plain files (cat) ssh -F ~/.ssh/ssh-file patroni-N-db-gprd.c.gitlab-production.internal "sudo cat /var/log/gitlab/postgresql/postgresql.csv" > postgresql.csv
# analyzing 1 log file, but you can analyze more passing the names at the endpgbadger --format csv --prefix '%m [%p, %x]: [%l-1] user=%u,db=%d,app=%a,client=%h' -o log_report.html --csv-separator ',' postgresql.csv.1
The output report will be in html file named log_report.html
The highlighted sections of the report
Section titled “The highlighted sections of the report”Queries reports:
Section titled “Queries reports:”The top tab, is one of the most important tabs, and show the information about slowest queries found in the logs, see the sections called:
- Time consuming queries
- Most frequent queries
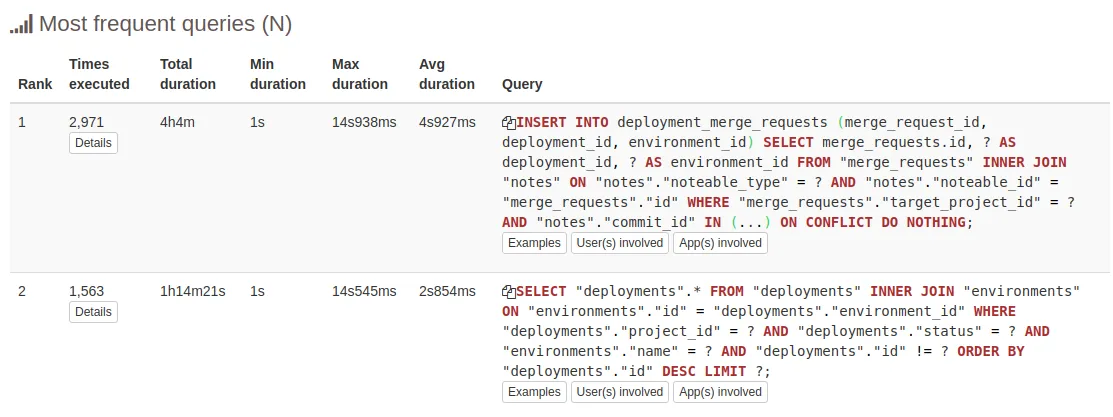
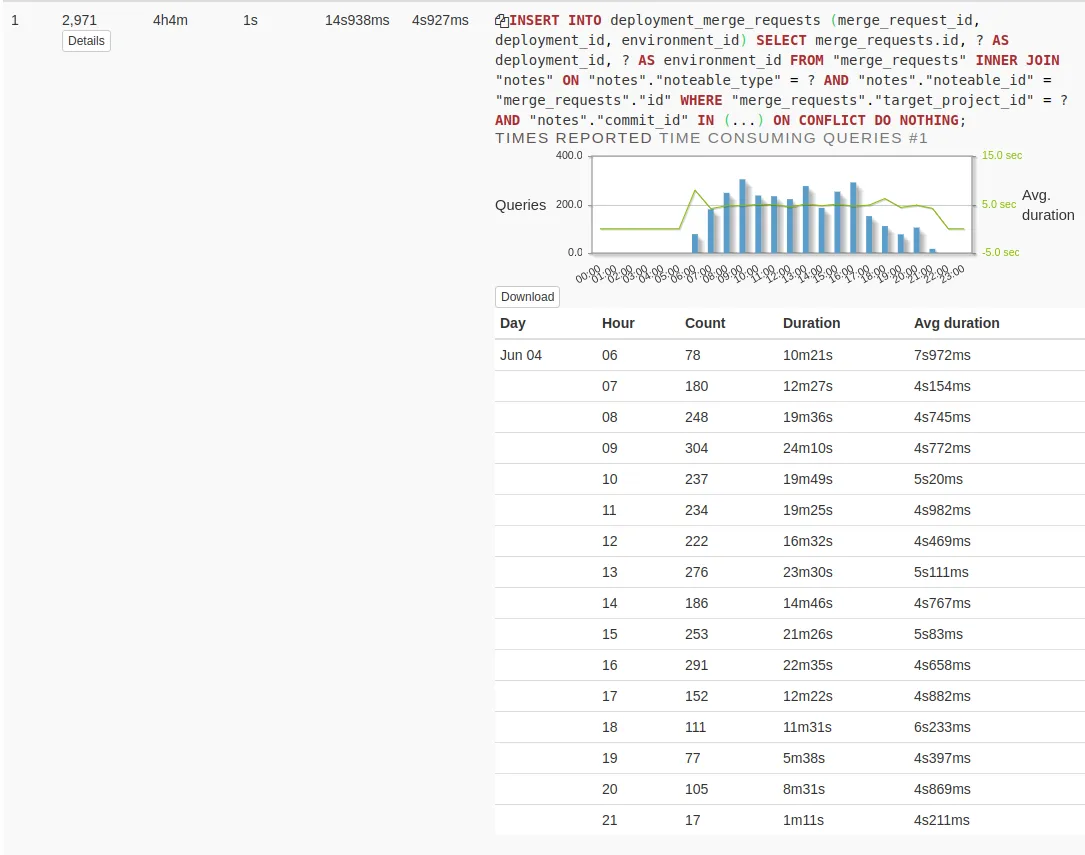
If make Click the button Details will see more info about this query related with count and duration
Queries
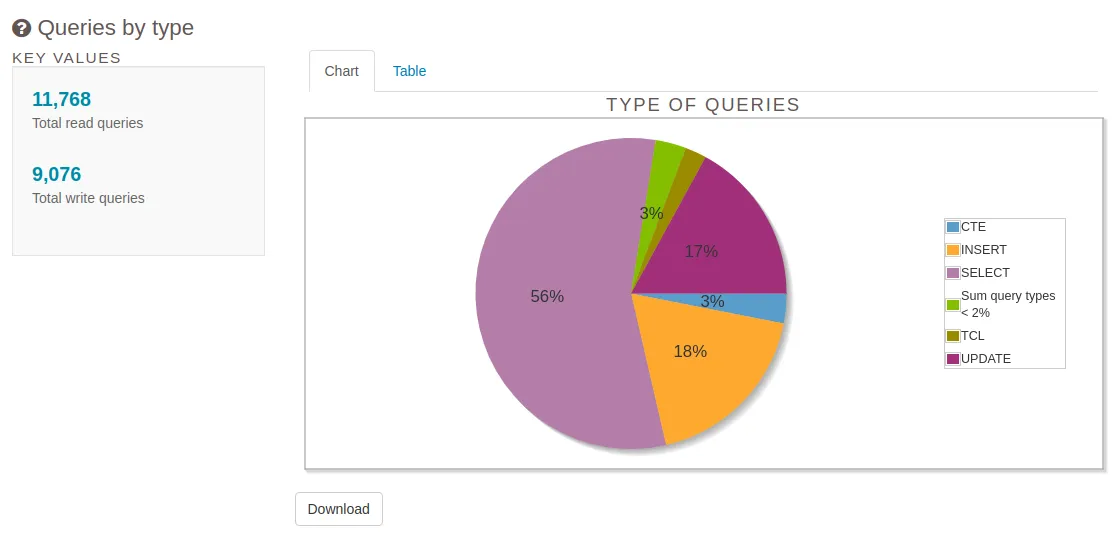
Section titled “Queries”The Queries tab show the statistical information about queries found in the logs, see the sections called:
- Queries by type
- Queries by host
General reports
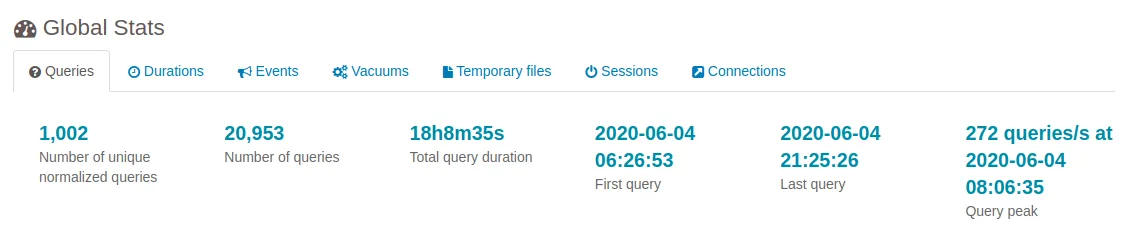
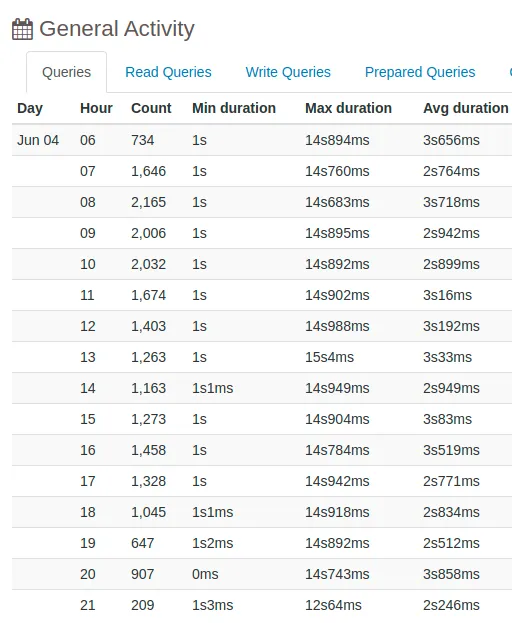
Section titled “General reports”Overview
Section titled “Overview”The overview tab shows some general statistical information, see the sections called:
- Global stats
- General Activity
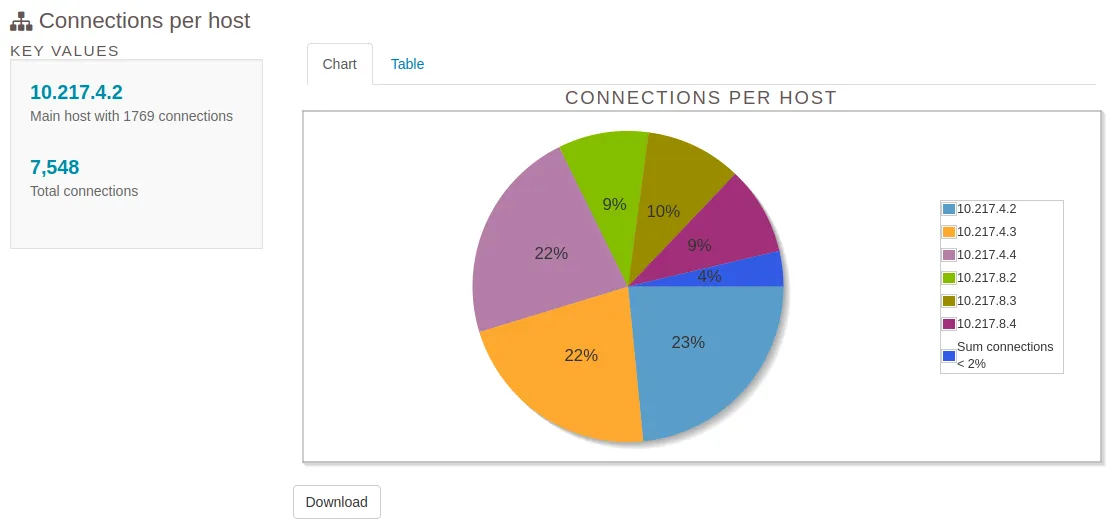
Connections
Section titled “Connections”The connections tab shows the graphs about connection information found in the logs, see the sections called:
- Connections per user
- Connections per host
Write reports:
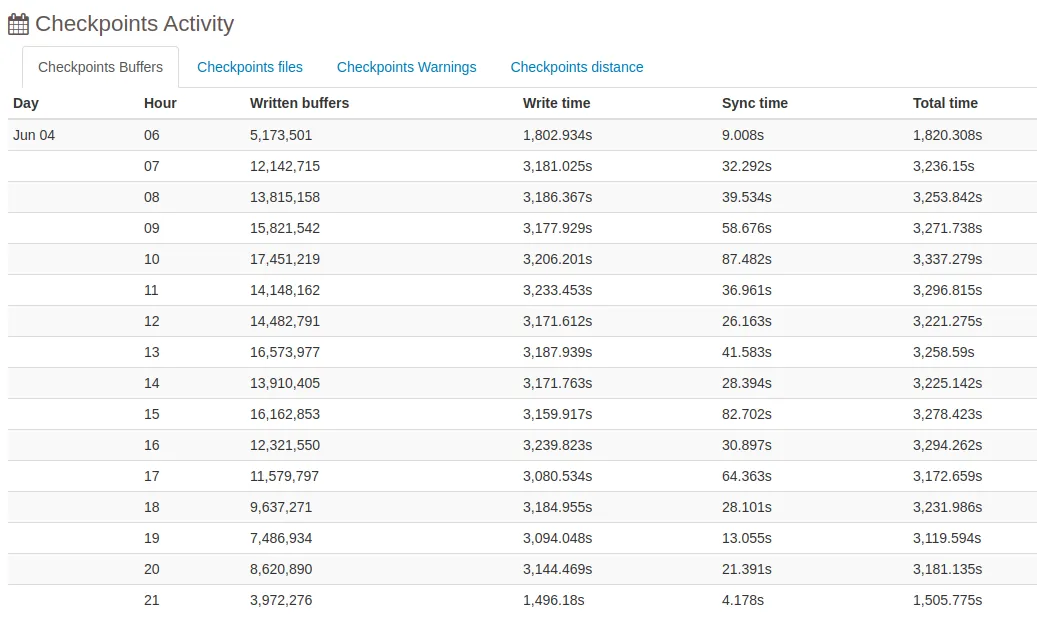
Section titled “Write reports:”Checkpoints
Section titled “Checkpoints”The checkpoints tab show the statistical information about the checkpoint process found in the logs, see the section called:
Checkpoints Activity
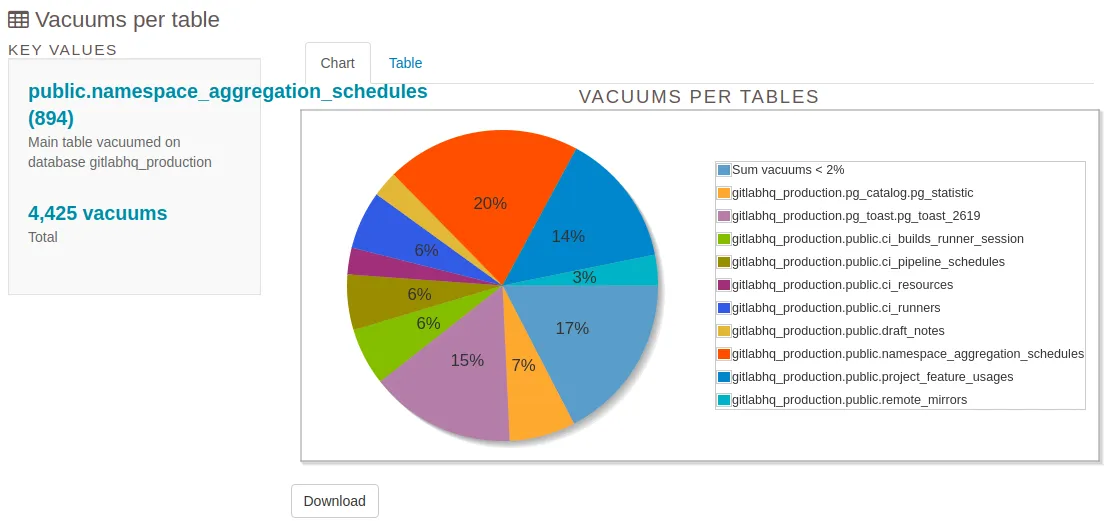
Vacuums
Section titled “Vacuums”The vacuums tab shows the information about VACUUMs and ANALYZEs occurring in the database found in the logs, see the sections called:
- Analyzes per table
- Vacuums per table
- Autovacuum Activity
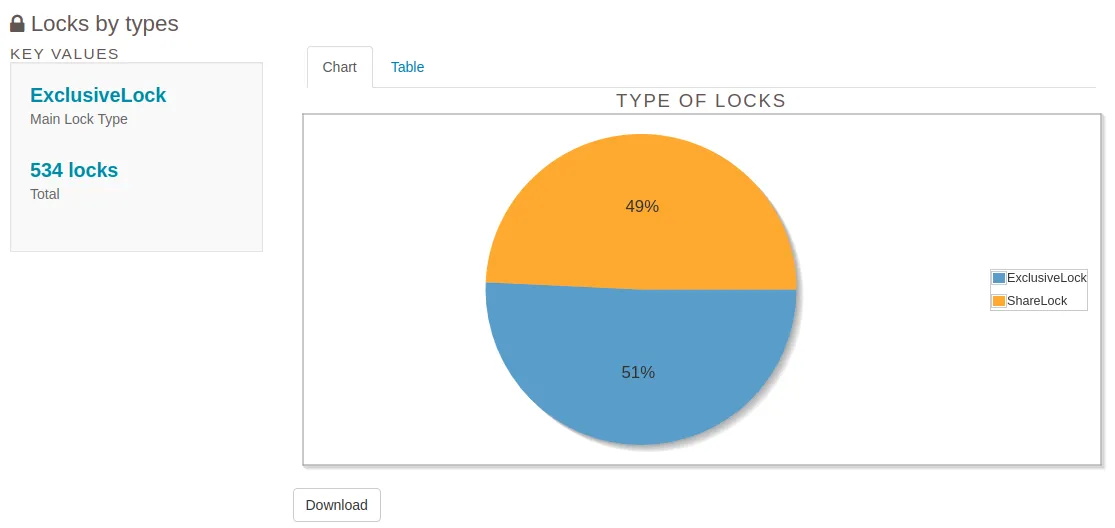
Locks and Events reports:
Section titled “Locks and Events reports:”The locks tab show the information about locks occurring in the database found in the logs, see all section here
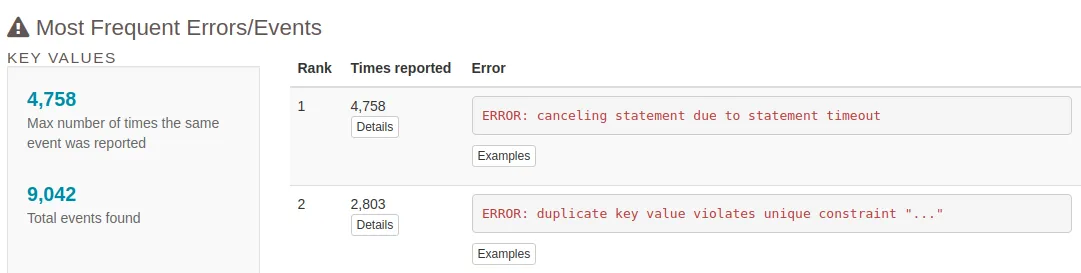
Events
Section titled “Events”The events tab show the anything information no show in another tabs, see the section called:
- Most Frequent Errors/Events