CiRunnersServiceQueuingQueriesDurationApdexSLOViolation
Overview
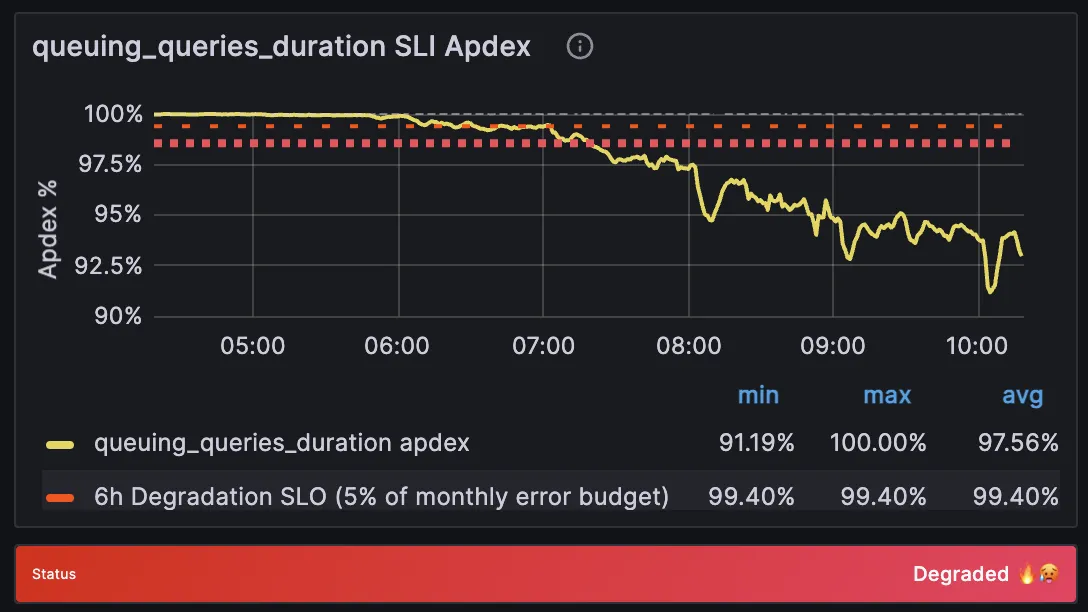
Section titled “Overview”This alert indicates that the CI Runners service is experiencing slower-than-expected queuing query response times, violating the defined Service Level Objectives (SLO) for job scheduling performance.
Services
Section titled “Services”Quick Links
Section titled “Quick Links”Contributing Factors
Section titled “Contributing Factors”- High volume of concurrent CI job requests
- Database performance issues
- Runner manager capacity constraints
- Resource exhaustion in the runner fleet
- Runner manager unable to spin ephemeral VMs
Affected Components
Section titled “Affected Components”- CI Runner job scheduling system
- Runner managers
- Database queries related to job queuing
- CI/CD pipeline execution times
Expected Action
Section titled “Expected Action”Investigate the cause of increased queuing duration and take appropriate action to restore normal service performance.
Metrics
Section titled “Metrics”- Metric: Duration of queuing-related queries for CI runners
- Unit: Milliseconds
- Normal Behavior: Query duration should remain below the Apdex threshold
- Threshold Reasoning: Based on historical performance data and user experience requirements
Alert Behavior
Section titled “Alert Behavior”- Silencing: Can be silenced temporarily during planned maintenance
- Expected Frequency: Medium - may trigger during peak usage periods
- Historical Trends: Check CI Runner alerts dashboard
Severities
Section titled “Severities”- The incident severity can range from Sev3 to Sev1 depending on the specific shard affected.
Impact Assessment
Section titled “Impact Assessment”- Affects all GitLab.com users trying to run CI jobs.
- May cause delays in CI/CD pipeline execution.
- Could affect both public and private projects.
Severity Checks
Section titled “Severity Checks”- Check number of affected jobs in the queue.
- Verify impact on pipeline completion times.
- Monitor error rates in job scheduling.
Verification
Section titled “Verification”- Check .com hosted runners logs.
- Review runner manager metrics.
- Monitor database performance metrics.
Troubleshooting
Section titled “Troubleshooting”Basic Steps
Section titled “Basic Steps”- Check for recent surge in CI job creation.
- Verify runner manager health.
- Review Patroni performance metrics.
- Check if GitLab.com usage has outgrown it’s surge capacity
Additional Checks
Section titled “Additional Checks”- Review scheduled pipeline timing conflicts.
- Verify runner pool capacity.
- Check for stuck jobs.
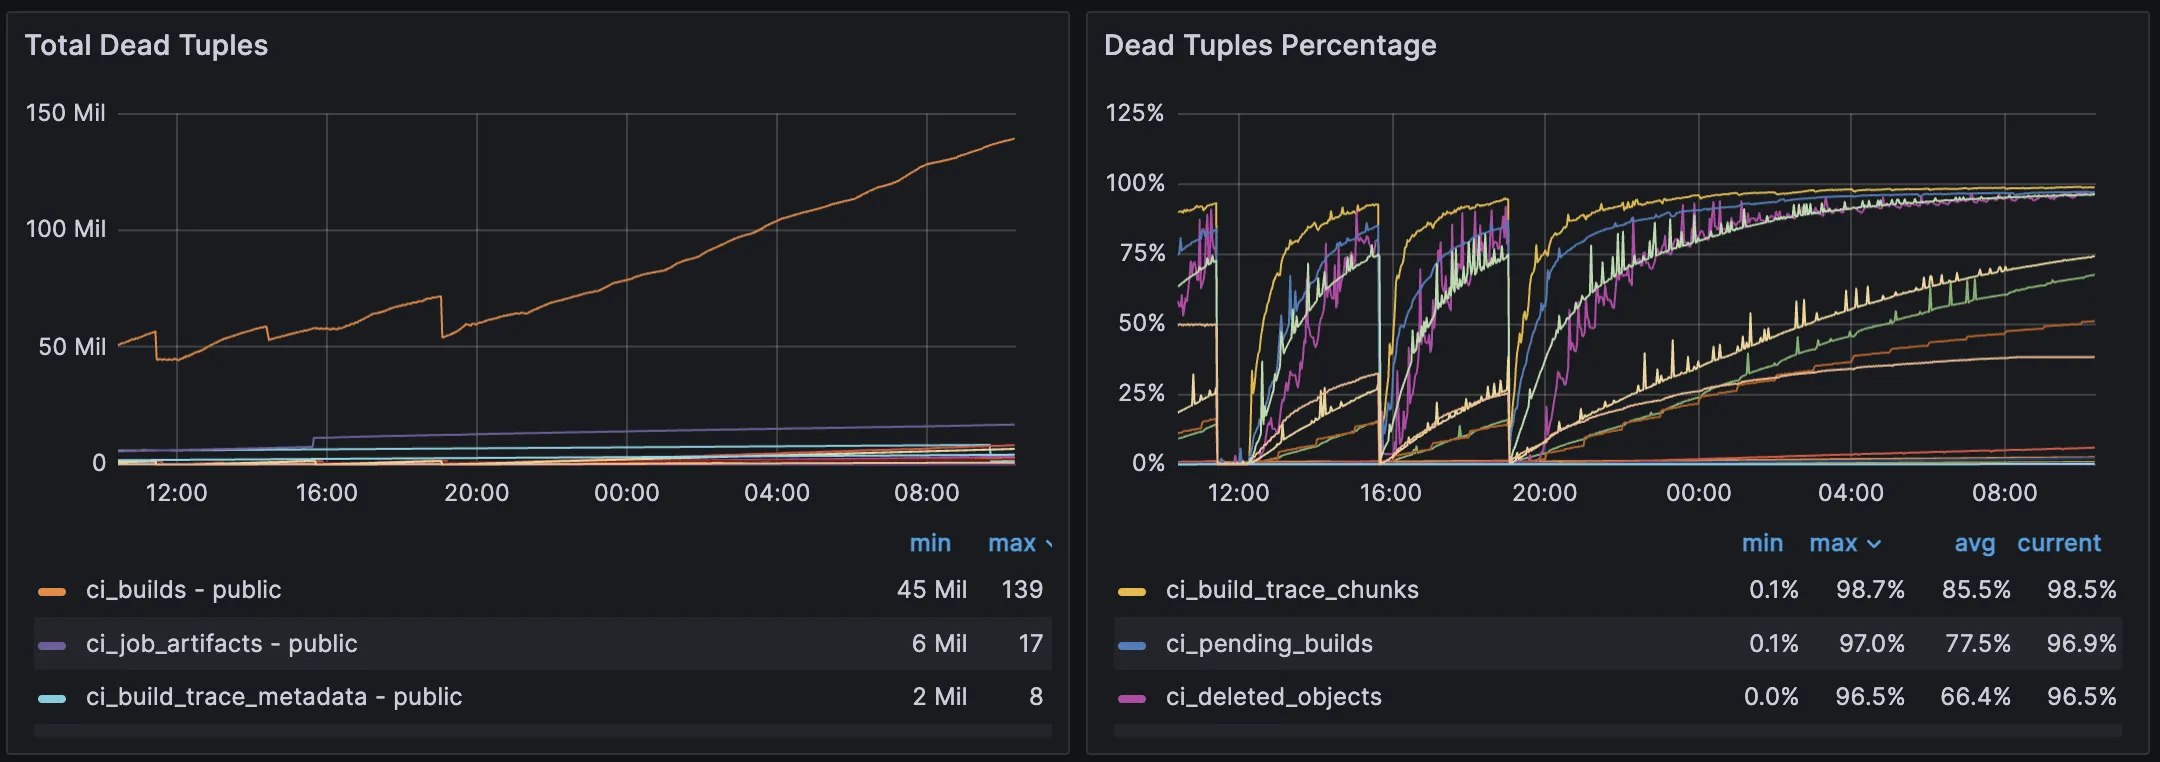
- Check for deadtuples-related issues below
Possible Resolutions
Section titled “Possible Resolutions”- Scale up runner manager capacity.
- Optimize database queries.
- Block abusive users/projects.
- Adjust job scheduling algorithms.
Verify for deadtuples-related performance issues
Section titled “Verify for deadtuples-related performance issues”During reindexing operations, deadtuples may accumulate and degrade query performance.
How to Check Ongoing Reindexing Operations
Section titled “How to Check Ongoing Reindexing Operations”Use the following SQL query to identify reindexing operations causing long query durations:
SELECT now(), now() - query_start AS query_age, now() - xact_start AS xact_age, pid, backend_type, state, client_addr, wait_event_type, wait_event, xact_start, query_start, state_change, queryFROM pg_stat_activityWHERE state != 'idle' AND backend_type != 'autovacuum worker' AND xact_start < now() - '60 seconds'::intervalORDER BY xact_age DESC NULLS LAST;How to Cancel Reindexing and Resume Deadtuple Cleanup
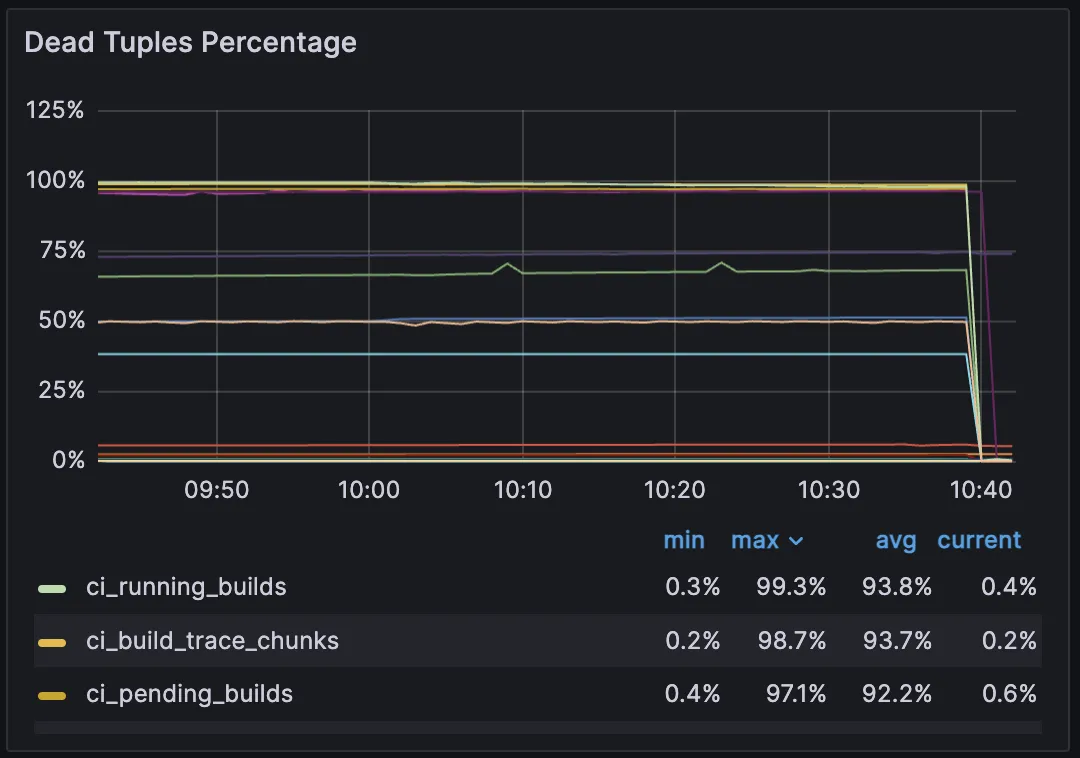
Section titled “How to Cancel Reindexing and Resume Deadtuple Cleanup”Use the pg_cancel_backend() function to cancel the ongoing reindexing operation, using the pid from the query above.
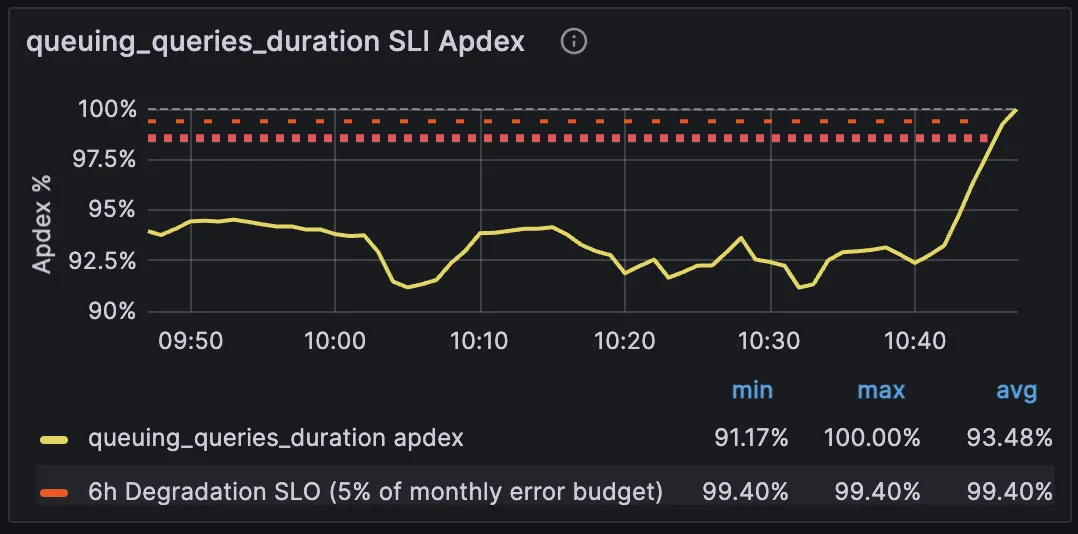
SELECT pg_cancel_backend(1641690);Once canceled, you should see immediate relief in the gitlab_ci_queue_retrieval_duration_seconds_bucket metrics
And SLI should recover
Recent changes
Section titled “Recent changes”- Recent CI runners Production Change/Incident Issues
- Recent chef-repo Changes
- Recent k8s-workloads Changes
Recent incidents
Section titled “Recent incidents”- CiRunnersServiceQueuingQueriesDurationApdexSLOViolation
- The queuing_queries_duration SLI of the ci-runners service (cny stage) has an apdex violating SLO
- CiRunnersServiceQueuingQueriesDurationApdexSLOViolation
Dependencies
Section titled “Dependencies”- PostgreSQL database
- Runner manager VMs
- Internal load balancers
- GCP infrastructure
Escalation
Section titled “Escalation”When to Escalate
Section titled “When to Escalate”- Alert persists for >30 minutes.
- Multiple runner shards affected.
- Significant impact on pipeline completion times.
Support Channels
Section titled “Support Channels”#productionSlack channel#g_hosted_runnersSlack channel#g_runnerSlack channel#f_hosted_runners_on_linuxSlack channel
Definitions
Section titled “Definitions”- Alert Definition
- Tuning Considerations: Adjust thresholds based on peak usage patterns and user feedback.