CiRunnersServicePollingErrorSLOViolation
Overview
Section titled “Overview”This alert indicates that CI Runners are experiencing elevated error rates when requesting jobs from GitLab. The runners make API requests to check for available work, and this alert fires when these requests fail at a rate exceeding our SLO.
Impact:
- Delayed job execution
- Increased pipeline duration
- Potential runner scaling issues
- Service degradation for CI/CD
Contributing factors:
- Network connectivity issues
- Database performance problems
- Runner manager resource saturation
- API endpoint availability issues
- GCP quota limitations
- Bugs introduced by recent deployment
Services
Section titled “Services”Key Dashboards
Section titled “Key Dashboards”Metrics
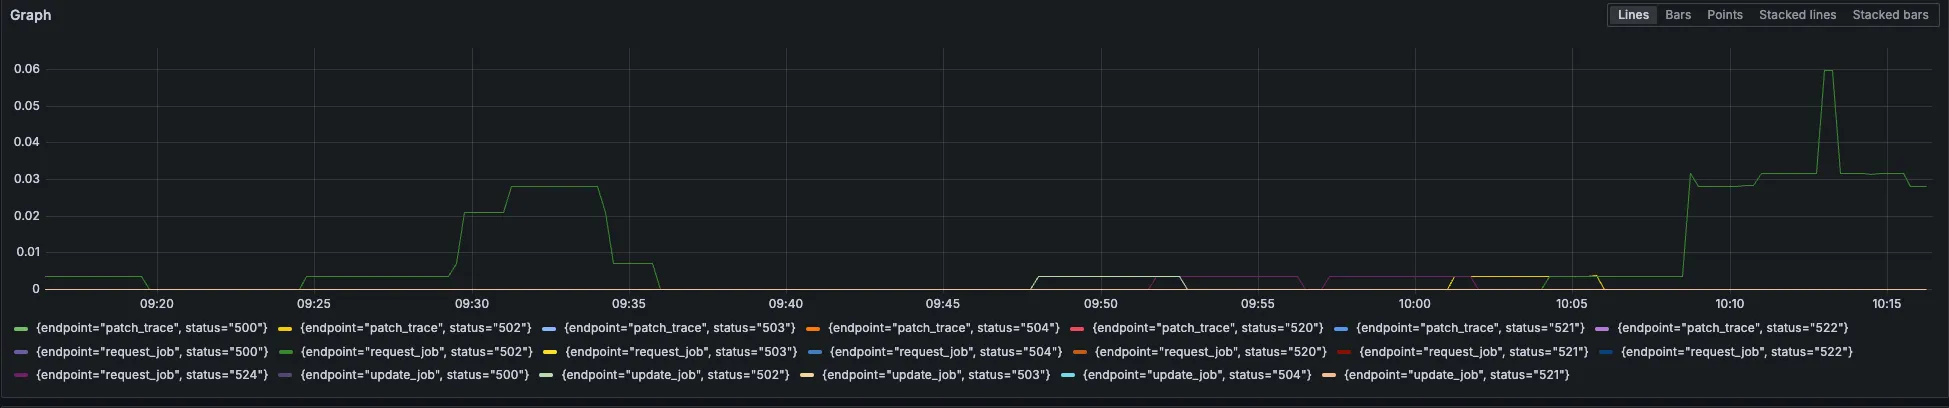
Section titled “Metrics”Primary Alert Metrics
Section titled “Primary Alert Metrics”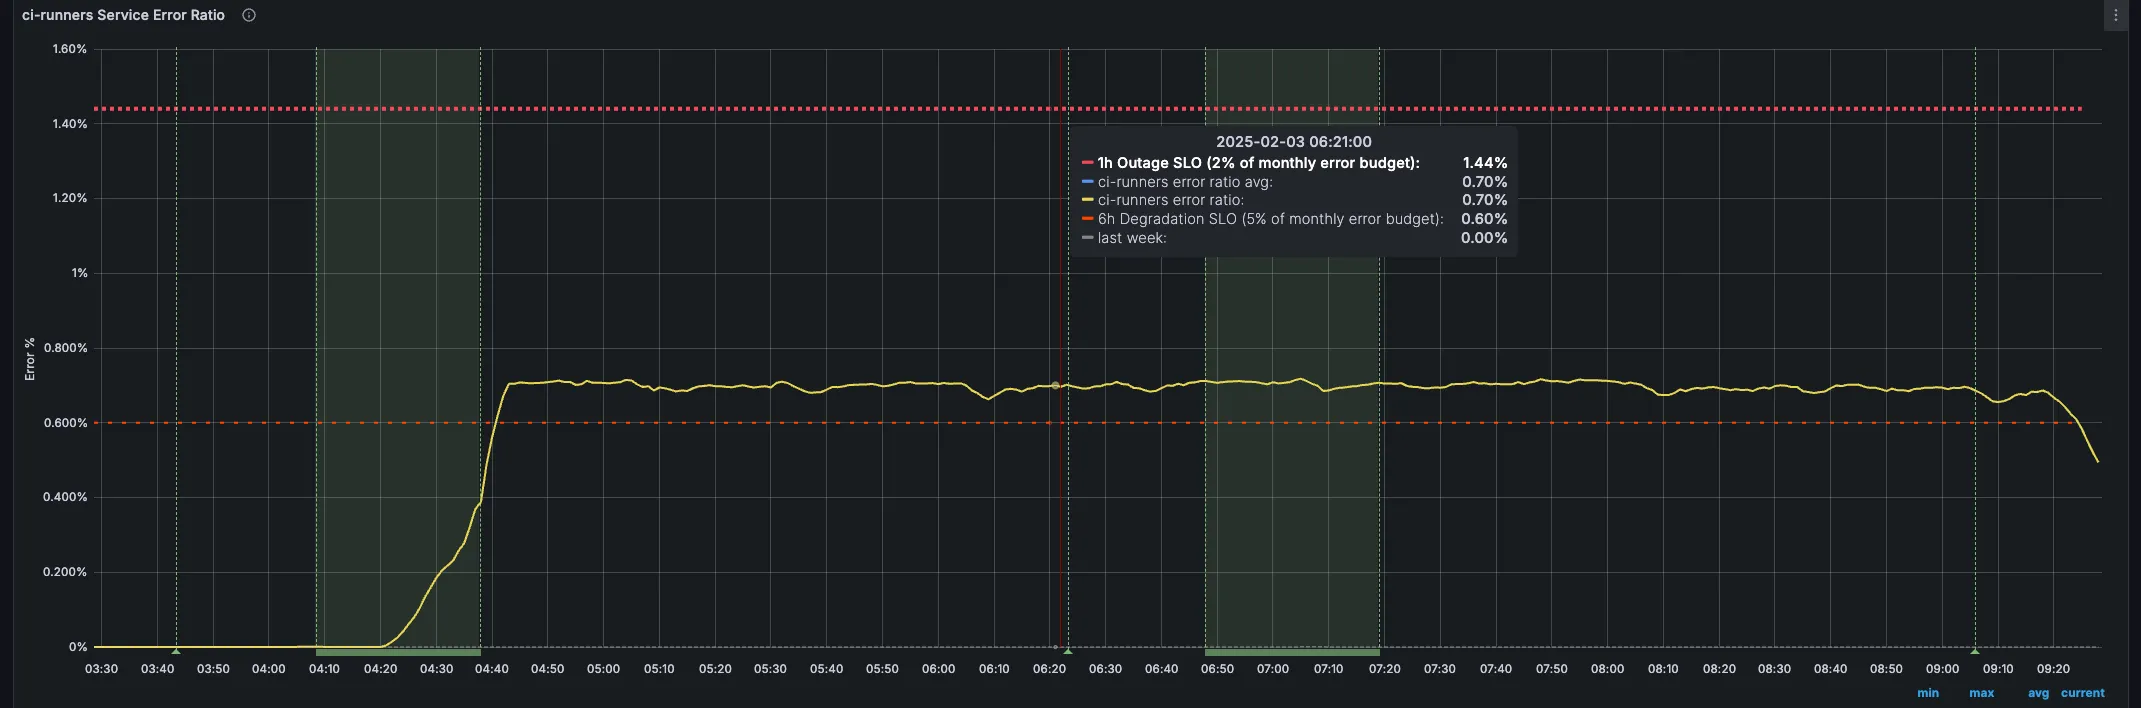
sum(rate(gitlab_runner_request_failures_total{environment="gprd"}[5m])) /sum(rate(gitlab_runner_requests_total{environment="gprd"}[5m])) * 100sum(rate(gitlab_runner_api_request_statuses_total{status=~"5.."}[5m])) by (status, endpoint)sum(rate(gitlab_runner_api_request_statuses_total{status=~"5.."}[5m])) by (status, endpoint)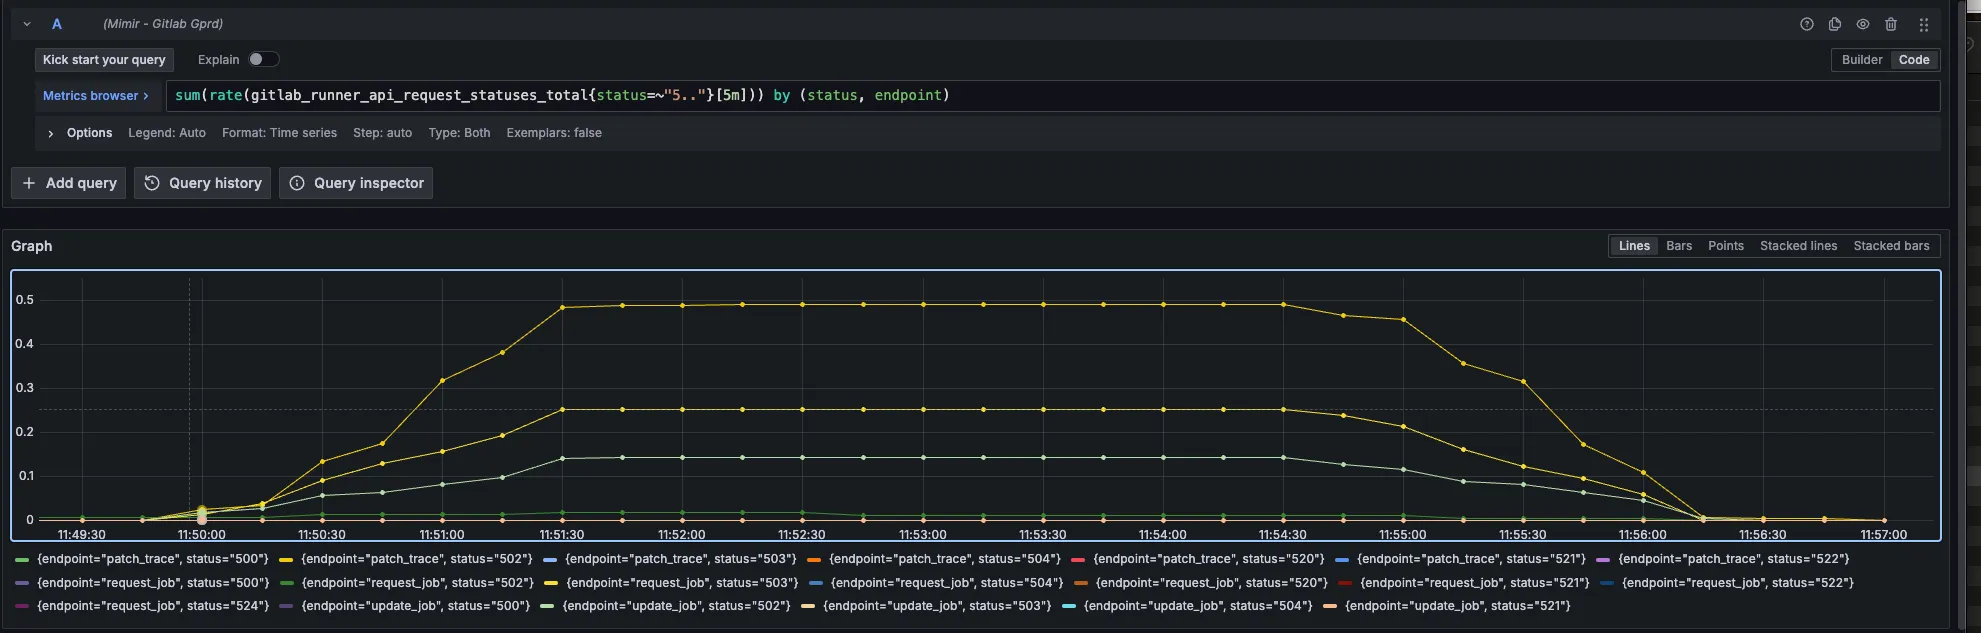
controller_action:gitlab_sql_duration_seconds_sum:rate1m{env="gprd",type="api",action="POST /api/jobs/request",controller="Grape"}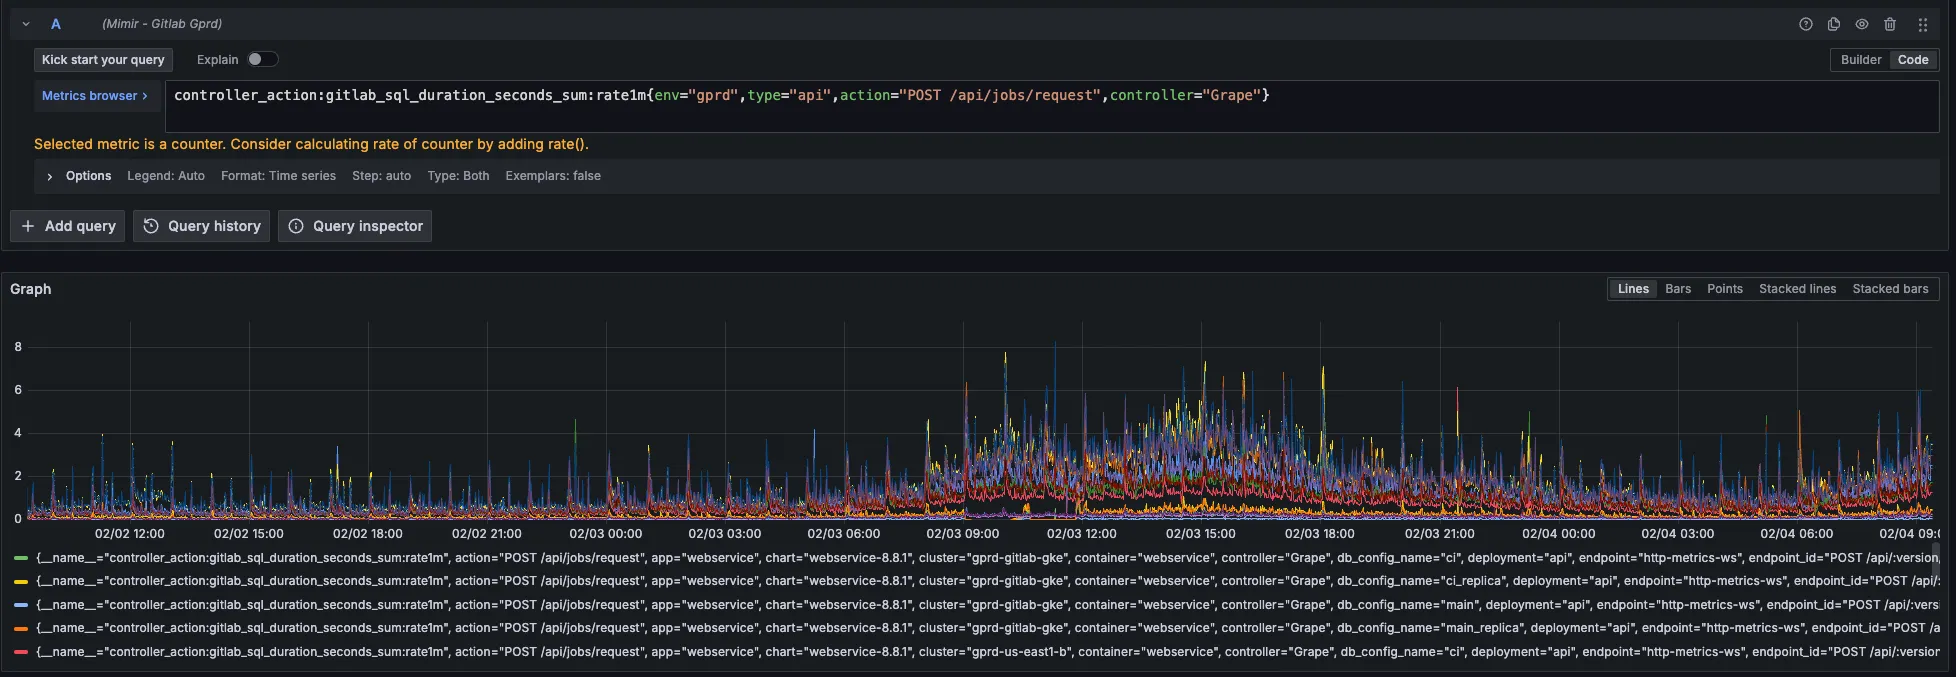
Job Processing Status
Section titled “Job Processing Status”-
An increase in the number of jobs in the
Pendingstate, would lead to a build up of the Pending jobs queue. -
Jobs in pulling stage: Check for accumalation of docker pull requests
sum(gitlab_runner_jobs{executor_stage="docker_pulling_image"}) by (instance)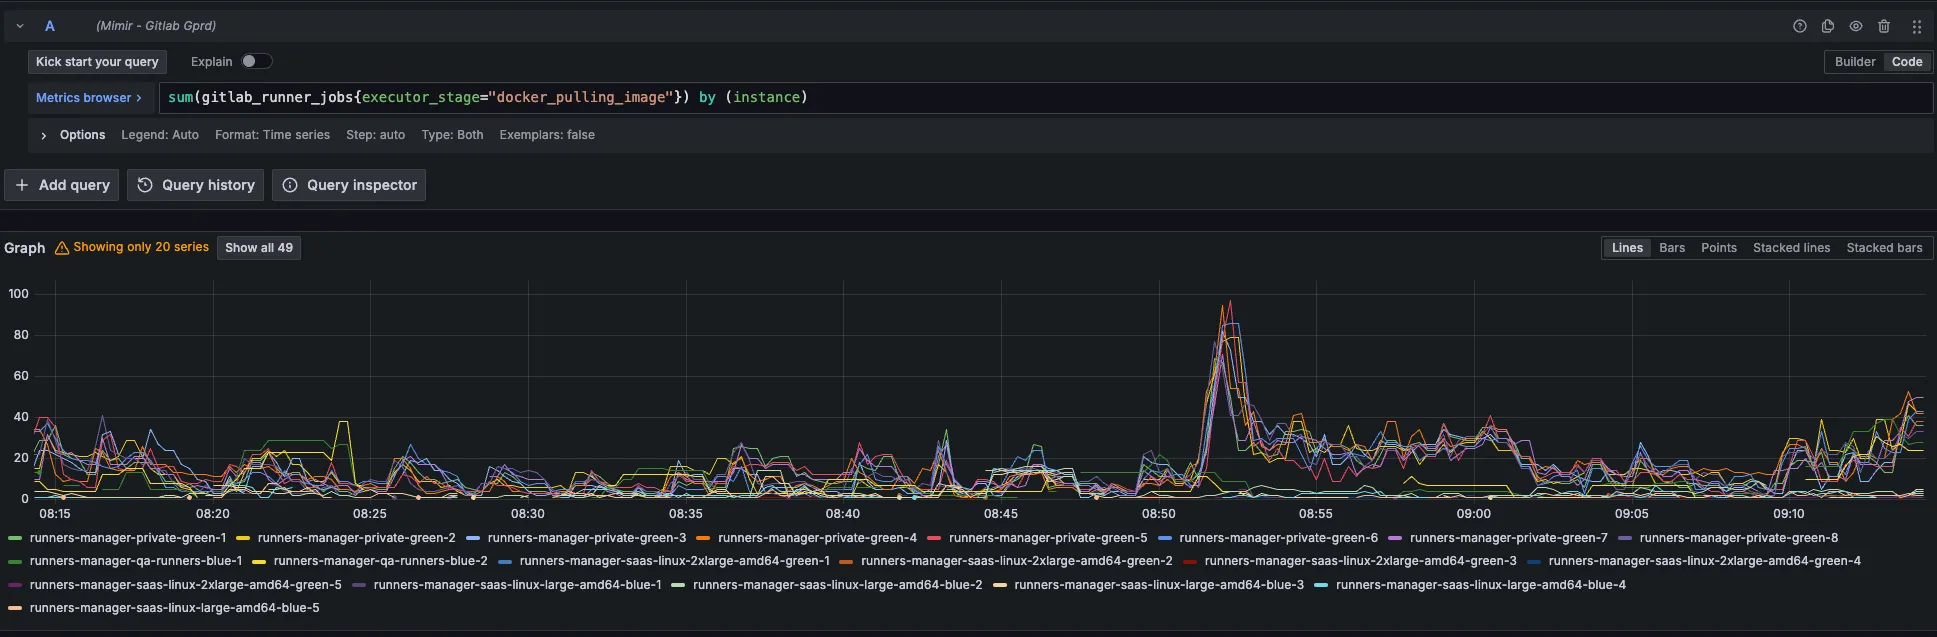
sum(gitlab_runner_jobs{executor_stage="docker_run"}) by (instance)sum(gitlab_runner_jobs) by (executor_stage)Alert Behavior
Section titled “Alert Behavior”This alert:
- Triggers on sustained polling errors
- May auto-resolve if temporary
- Often correlates with application issues
- Can indicate broader network problems
Common patterns from incidents:
- Network routing changes
- Database performance issues
- Runner manager scaling events
- API endpoint availability
- GCP quota limitations
- Recent Deployments
Severities
Section titled “Severities”Default servity is ~severity::3 if there is limited pipeline impact but should be updaraged to ~severity::2 if multiple runners managers are affected
Recent Incidents
Section titled “Recent Incidents”- CI Runners increase in error ratios
- Polling SLI of the ci-runners service has an error rate violating SLO (ops)
- The polling SLI of the ci-runners service (main stage) has an error rate violating SLO
Recent changes
Section titled “Recent changes”- Recent CI runners Production Change/Incident Issues
- Recent chef-repo Changes
- Recent k8s-workloads Changes
Dependencies
Section titled “Dependencies”- PostgreSQL database
- Runner manager VMs
- Internal load balancers
- GCP infrastructure
Escalation
Section titled “Escalation”When to Escalate
Section titled “When to Escalate”- Alert persists for >30 minutes.
- Multiple runner shards affected.
- Significant impact on pipeline completion times.
Support Channels
Section titled “Support Channels”#productionSlack channel#g_hosted_runnersSlack channel#g_runnerSlack channel#f_hosted_runners_on_linuxSlack channel
Definitions
Section titled “Definitions”- Alert Definition
- Tuning Considerations: Adjust thresholds based on peak usage patterns and user feedback.