CiRunnersServiceCiRunnerJobsApdexSLOViolationSingleShard
Overview
Section titled “Overview”CI Runner Shard Performance Degradation (Apdex Score)
Section titled “CI Runner Shard Performance Degradation (Apdex Score)”This alert indicates that a specific CI runner shard is not meeting its performance targets, as measured by its Apdex score for job execution. The Apdex score evaluates the ratio of jobs that complete within a satisfactory response time versus the total job execution attempts for the given shard. A drop in this score suggests that CI job execution performance is degrading, impacting developer workflows and overall pipeline efficiency.
Impact
Section titled “Impact”- Delayed job execution on the affected shard
- Increased pipeline duration, leading to slower feedback loops
- Jobs stuck in a pending state, waiting for available runners
- Potential timeout failures if jobs exceed execution thresholds
- Queue buildup, increasing job wait times and impacting CI/CD throughput
Contributing Factors
Section titled “Contributing Factors”Several factors can lead to degraded CI runner performance and a lower Apdex score, including:
- Resource saturation on runner managers, causing job execution slowdowns
- TLS certificate issues, leading to authentication failures for API requests
- Network connectivity problems, impacting job retrieval and execution
- Docker image pull delays, slowing down job startup times
- GCP quota limitations, restricting the availability of compute resources
- Configuration changes affecting runner behavior or performance settings
- Auto-scaling limitations, preventing the timely provisioning of additional runners
This alert helps detect and diagnose such issues early, enabling corrective actions to restore normal CI job execution performance.
Services
Section titled “Services”Key Dashboards
Section titled “Key Dashboards”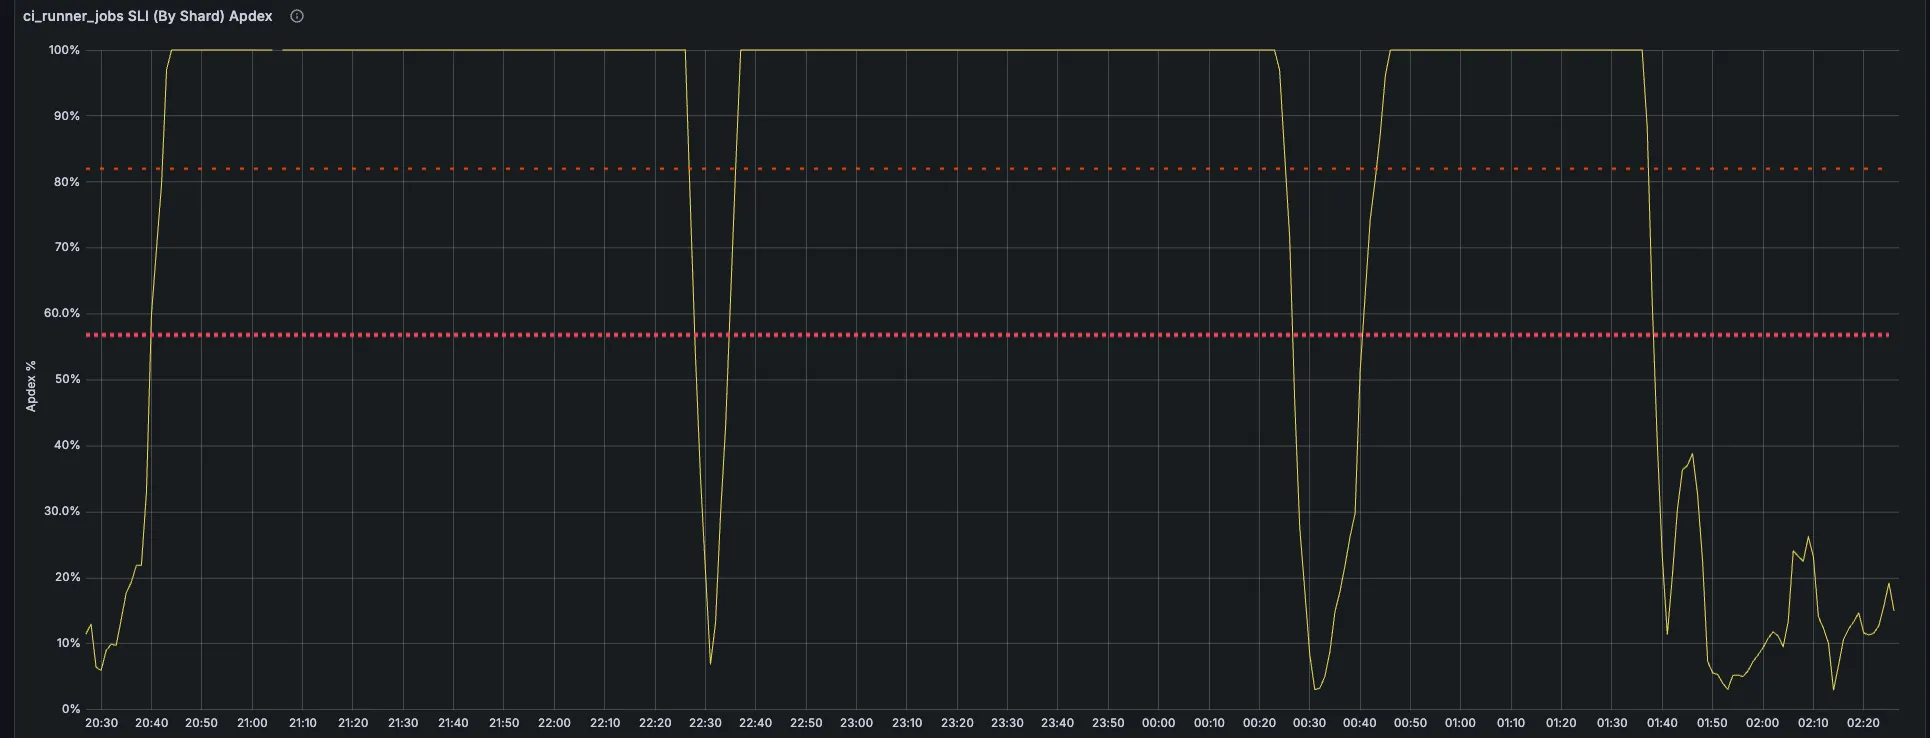
Metrics
Section titled “Metrics”Primary Alert Metrics
Section titled “Primary Alert Metrics”gitlab_runner_acceptable_job_queuing_duration_exceeded_total
gitlab_component_shard_apdex:ratio_1h{component="ci_runner_jobs"}
gitlab_runner_job_queue_duration_seconds_bucket
gitlab_runner_autoscaling_machine_creation_duration_seconds_countOther Metrics to check
Section titled “Other Metrics to check”- Machine states (creating/running/removing)
- CPU utilization per runner manager
- Network egress rates
- Docker image pull times
- Job execution states
Normal vs Alert State Patterns
Section titled “Normal vs Alert State Patterns”Normal state:
- Queue duration p95 < 2 minutes
- Pending jobs < 1000
- Machine creation success > 95%
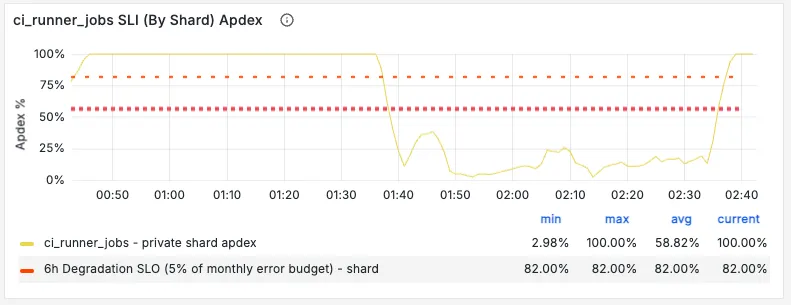
- Apdex score > 0.82
Alert state:
- Queue duration p95 > 10 minutes
- Pending jobs > 7000
- Machine creation success < 80%
- Apdex score < 0.82
Alert Behavior
Section titled “Alert Behavior”This alert:
- Triggers when both 6h and 30m windows breach thresholds
- Requires minimum operation rate
- Often correlates with resource saturation
- May indicate configuration issues
Common patterns from incidents:
- Peak traffic periods
- Post-deployment issues
- Certificate rotation events
- Infrastructure scaling events
- Weekend capacity adjustments
Severities
Section titled “Severities”Default severity is ~severity::3 but should be upgraded to ~severity::2 if:
- Multiple shards affected
- Customer-facing shared runners impacted
- Queue times > 15 minutes for > 30 minutes
- Affects > 10% of total jobs
Severity 4 when:
- Single internal shard affected (e.g.
privateorgitlab-orgshard) - No customer impact
- Recovers within 15 minutes
Recent Incidents
Section titled “Recent Incidents”- Private runners failing to meet apdex SLO
- Shared runners saturation causing apdex violation
- TLS certificate expiration affecting runners
Recent changes
Section titled “Recent changes”Troubleshooting
Section titled “Troubleshooting”Based on incident #18667:
1. Verify Shard Status
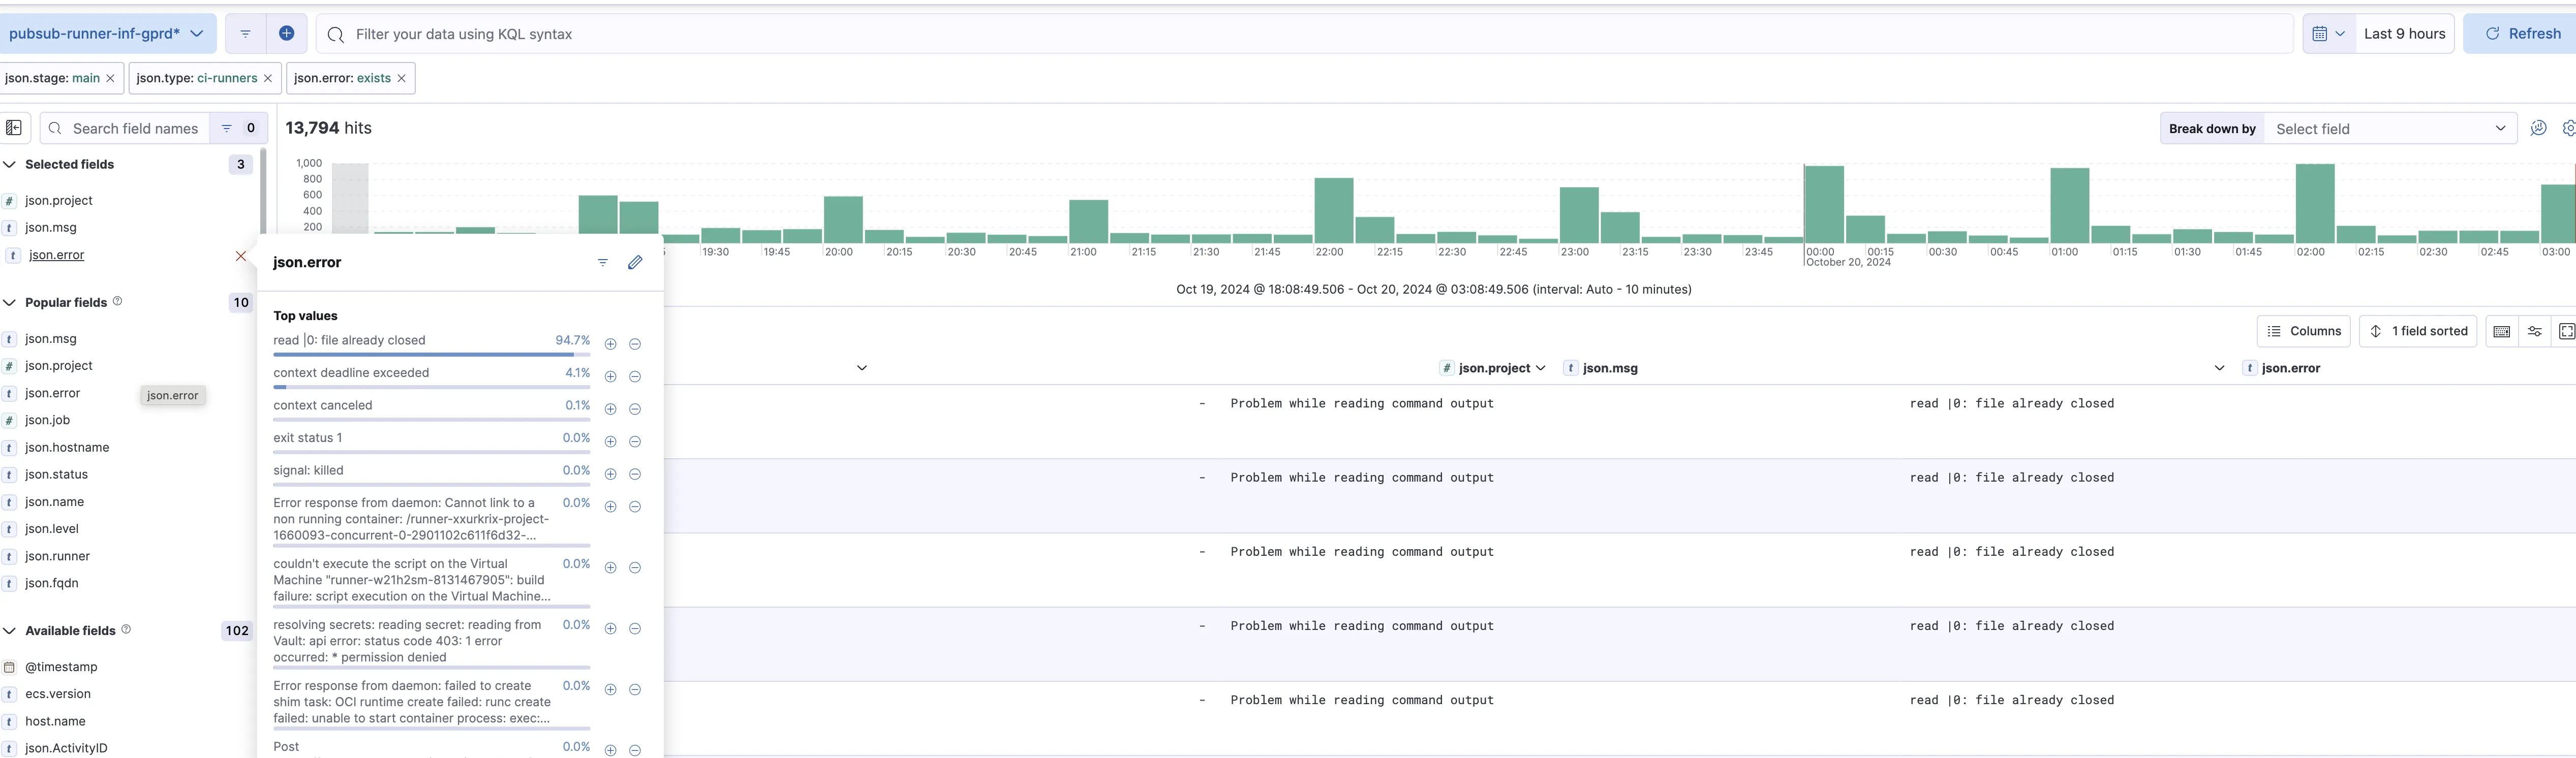
Section titled “1. Verify Shard Status”- Check if a specific shard is affected, for example, by using the
json.shardfilter in Kibana. - Common shards that have shown issues:
private,gitlab-org,tamland - Most issues appear in these shards due to resource constraints
2. Check Runner Manager Logs
Section titled “2. Check Runner Manager Logs”sudo docker-machine ls
sudo cat /root/.docker/machine/certs/ca.pem | openssl x509 -noout -enddatesudo cat /root/.docker/machine/certs/cert.pem | openssl x509 -noout -enddate3. Machine Creation Investigation
Section titled “3. Machine Creation Investigation”knife ssh -C 10 'roles:gitlab-runner-base-gce' 'sudo cat /root/.docker/machine/certs/ca.pem | openssl x509 -noout -enddate' | sort -k54. Performance Analysis
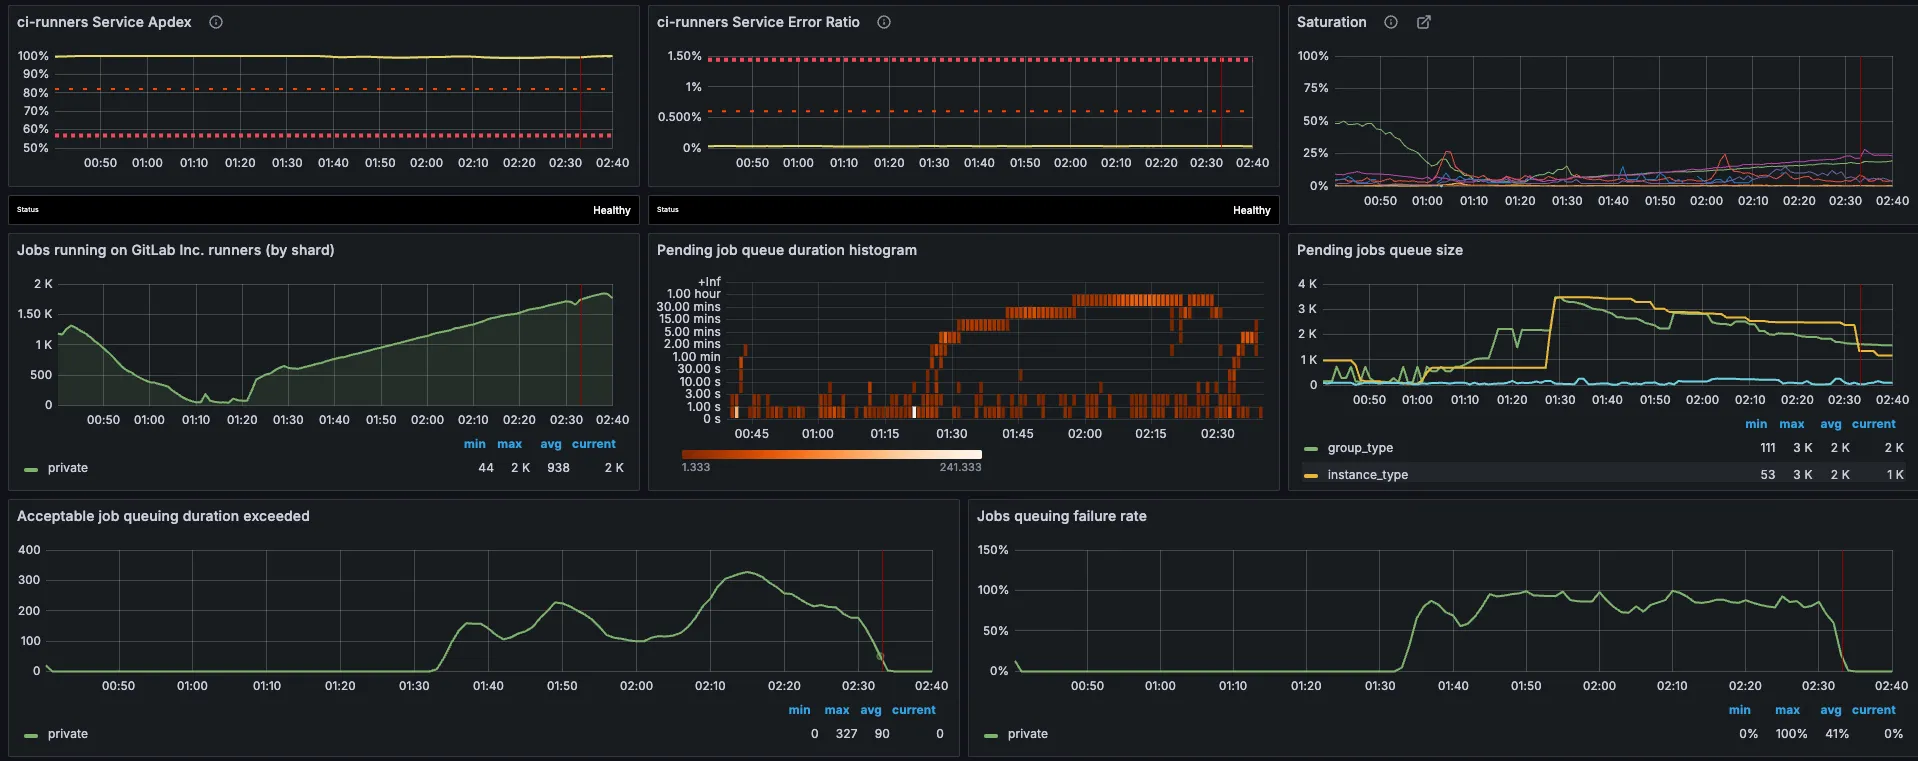
Section titled “4. Performance Analysis”- Check CI runners overview dashboard
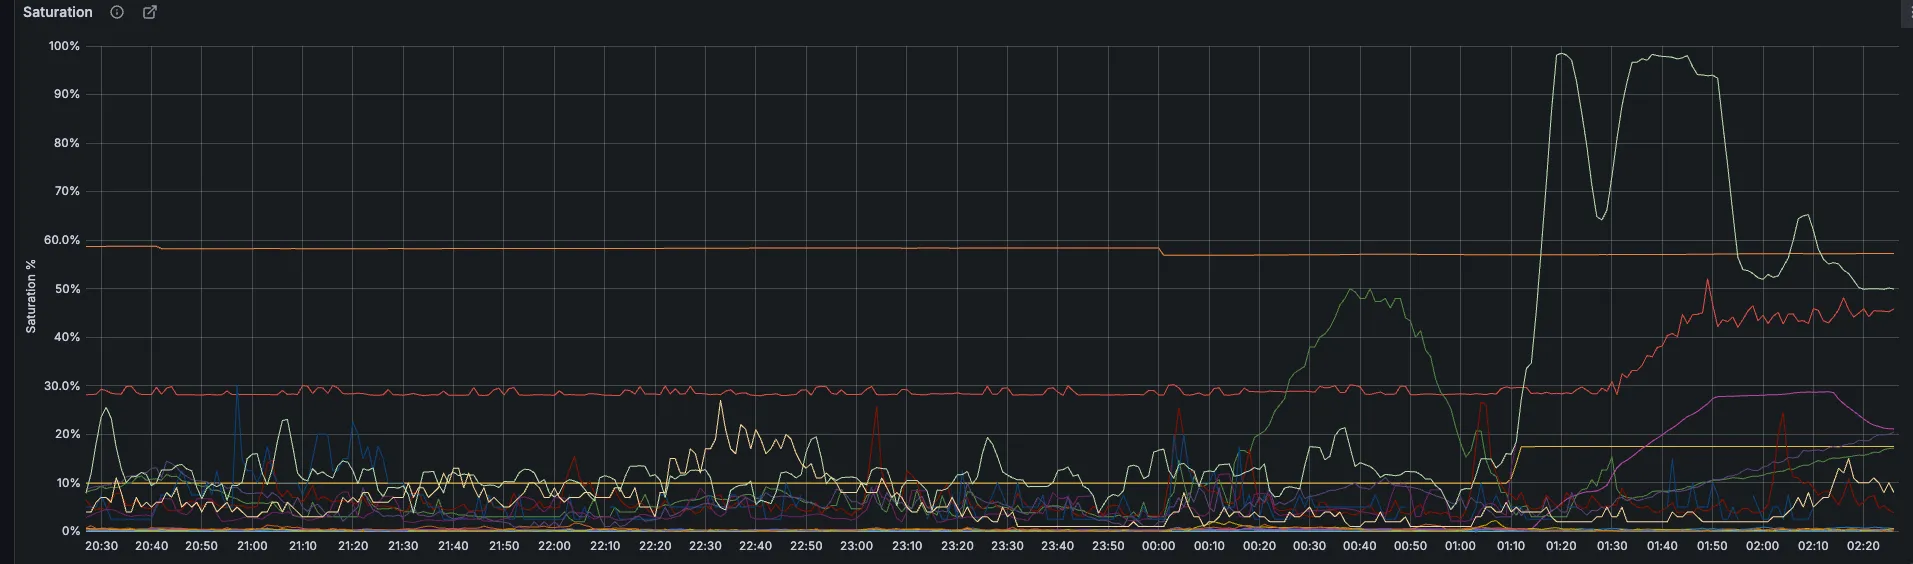
- Monitor Runner saturation metrics
- Review job queue duration trends
5. Recovery Verification
Section titled “5. Recovery Verification”After changes:
- Check if the Apdex score is improving
- Monitor pending jobs queue length
- Verify jobs are being processed normally
Dependencies
Section titled “Dependencies”External:
- GCP Compute API
- Docker Hub Registry
- Cloud provider network
Internal:
- Gitaly service
- PostgreSQL database
- Redis
- Object storage
- Runner manager nodes
Escalation
Section titled “Escalation”When to Escalate
Section titled “When to Escalate”- Alert persists > 30 minutes
- Multiple shards affected
- Customer impact reported
- Infrastructure quotas reached
Support Channels
Section titled “Support Channels”#productionSlack channel#g_hosted_runnersSlack channel#g_runnerSlack channel#f_hosted_runners_on_linuxSlack channel
Definitions
Section titled “Definitions”- Alert Definition
- Tuning Considerations: Thresholds based on historical performance data and SLO requirements